|rr
Notice of Annual General Meeting
of
Shareholders and
2021
2023 Proxy Statement

Your vote is important
Please vote by using the Internet, the telephone,
or by mailing your completed voting information form or proxy card
SECURITIES AND EXCHANGE COMMISSION
WASHINGTON,
Washington, D.C. 20549
Proxy Statement Pursuant to Section 14(a) of
the
Securities Exchange Act of 1934
(Amendment No. )
AXIS CAPITAL HOLDINGS LIMITED
(Name of Person(s) Filing Proxy Statement, if other than the Registrant)
| (Name of Person(s) Filing Proxy Statement, if other than the Registrant) | ||
| ☒ | ||||||||
| No fee required. | ||||||||
| ☐ | ||||||||
| ||||||||
| ||||||||
| ||||||||
| ||||||||
| ||||||||
| Fee paid previously with preliminary materials. | ||||||||
| ☐ | ||||||||
| ||||||||
| ||||||||
| ||||||||
| ||||||||
of
2021
24, 2023
You
As permitted by the rules of the Securities and Exchange Commission, we are also pleased to be furnishing our proxy materials to shareholders primarily over the Internet. We believe this process expedites shareholders’ receipt of the materials, lowers the costs of the Annual General Meeting and conserves natural resources. We sent a Notice of Internet Availability of Proxy Materials on or about March 26, 2021 to our beneficial shareholders at the close of business on March 12, 2021. The notice contains instructions on how to access our Proxy Statement and 2020 Annual Report and vote online. If you would like to receive a printed copy of our proxy materials from us instead of downloading a printable version from the Internet, please follow the instructions for requesting such materials included in the notice.
Bermuda.


Chairman

  |
Thursday, May | |||||||||||||||
 | ||||||||||||||||
|
| |||||||||||||||
| AXIS House 92 Pitts Bay Road Pembroke HM 08 Bermuda Directions and instructions on how to attend the 2023 Annual General Meeting in person may be obtained by contacting our Corporate Secretary at: 1-441-496-2600. | |||||||||||||||
|
| |||||||||||||||
| ||||||||||||||||
| To elect the four Class | ||||||||||||||||
| 2. | To approve, by non-binding vote, the compensation paid to our named executive officers; | |||||||||||||||
| 3. | To determine, by non-binding vote, whether a shareholder vote to approve the compensation of our named executive officers should occur every one, two or three years; | |||||||||||||||
| 4. | To approve an amendment to our Amended and Restated 2017 Long-Term Equity Compensation Plan, increasing the aggregate number of shares of common stock authorized for issuance; | |||||||||||||||
| 5. | To appoint Deloitte Ltd., Hamilton, Bermuda, to act as our independent registered public accounting firm for the fiscal year ending December 31, | |||||||||||||||
| 6. | To transact such other business as may properly come before the meeting or any postponement or adjournment thereof. | |||||||||||||||
 | ||||||||||||||||
| Close of business on March | |||||||||||||||
 | ||||||||||||||||
| G. Christina Gray-Trefry Corporate Secretary March 24, 2023 | ||||||||||||||||

Conrad D. Brooks
Corporate Secretary
March 26, 2021
Important Notice Regarding the Availability of Proxy Materials for the Annual General Meeting to be held on May 7, 2021: This Notice of Annual General Meeting of Shareholders and Proxy Statement are being distributed or made available, as the case may be, on or about March 26, 2021. The Proxy Statement, the 2020 Annual Report to Shareholders and the Form 10-K of AXIS Capital Holdings Limited for 2020 are available at https://materials.proxyvote.com/G0692U.
PLEASE VOTE VIA THE INTERNET OR BY TELEPHONE BY FOLLOWING THE VOTING INSTRUCTIONS PRINTED ON THE NOTICE OF INTERNET AVAILABILITY OF PROXY MATERIALS, WHETHER OR NOT YOU PLAN TO ATTEND THE MEETING. IF YOU LATER DESIRE TO REVOKE YOUR PROXY FOR ANY REASON, YOU MAY DO SO IN THE MANNER DESCRIBED IN THE ATTACHED PROXY STATEMENT.

Important Notice Regarding the Availability of | |||||||||||||||
 Your vote is very important. Whether or not you plan to attend the Annual Meeting, please vote at your earliest convenience by following the instructions in the Notice of Internet Availability of Proxy Materials or the proxy card you received in the mail. You may revoke your proxy at any time before it is voted. Please refer to “Voting and Meeting Information” for additional information. | |||||||||||||||
| Table of Contents | |||||
Human Capital and Compensation Committee Interlocks and Insider Participation | ||||||||
Other Compensation Topics | ||||||||
Human Capital and Compensation Committee Report | ||||||||
|
|
|
|
92 Pitts Bay Road
Pembroke HM 08
Bermuda
|
|
|
|
|
|
| |||||||
| PROXY STATEMENT SUMMARY | ||||||
|
|
|
|
|
| Annual General Meeting Date and Time | Thursday, May 4, 2023 - 8:30 a.m. ADT | ||||||||||
| Location | | AXIS House 92 Pitts Bay Road Pembroke HM 08 Bermuda Please refer to "Voting and Meeting Information” for additional information. | |||||||||
| ||||||||||||||
| Agenda and Vote Recommendations | ||||||||||||||
| Proposal | Vote Recommendation | For More Information | ||||||||||||
1.Election of the | ||||||||||||||
|
Transitioning seamlessly to a virtual workplace environment and suspending all nonessential business travel, with limited or no business interruption
Providing employees with regular live updates delivered by our Chief Executive Officer
Furnishing employees with a work-from-home office and technology stipend
Developing educational tools and materials focused on the health and well-being of our employees, including remote working best practices, leadership of virtual teams and managing stress while working from home
Adding half-day well-being days and allowing flexibility with paid time off and sick leave policies for employees directly impacted by COVID-19
Continuous monitoring of health information and shelter-in-place orders to assess the reopening of offices
Maintaining our excellent service standards in a virtual working environment
Launching a virtual broker lounge, giving our brokers convenient, direct access to our underwriters via video, instant messaging or one-click calling
Committing $1 million to support COVID-19 relief efforts, with a portion dedicated to supporting underserved communities disproportionately impacted by the pandemic
| FOR each nominee | Page 4 | ||||||||||||
2.Company's executive compensation | FOR | Page 30 | ||||||||||||
3.Timing of shareholder vote to approve the Company's executive compensation ("Say When on Pay") | 1 YEAR | Page 30 | ||||||||||||
4.Approve an amendment to our Amended and Restated 2017 Long-Term Equity Compensation Plan | FOR | Page 80 | ||||||||||||
5.Appointment of Deloitte Ltd. ("Deloitte") as the Company's independent registered public accounting firm for the 2023 fiscal year | FOR | Page 87 | ||||||||||||
| We may also transact any other business that may properly come before the meeting. As of the date of this proxy statement, we are not aware of any business to be presented for consideration other than the matters described | ||||||||||||||
| ||||||||
| Record Date | March 10, 2023 | |||||||
| 2022 Company Financial Performance | In 2022, AXIS advanced its efforts to strengthen its business, reposition its portfolio, reduce volatility, and drive profitable growth in attractive markets - while capitalizing on favorable market conditions. Operating return on average common equity (“OROACE”) AXIS' 2022 financial results for these performance metrics on an absolute basis are set forth below: | |||||||
 | ||||||||
| PROXY STATEMENT SUMMARY | 1 | |||||||
| Measure | Fiscal Year 2022 | Change versus Fiscal Year 2021 | ||||||||||||
OROACE(1) | 11.1% | +2.0% pts | ||||||||||||
Adjusted OROACE(2) | 10.2% | N/A | ||||||||||||
ROACE(3) | 4.3% | -7.9% pts | ||||||||||||
Total Shareholder Return(4) | 2.6% | -9.2% pts | ||||||||||||
(1)"OROACE" is operating return on average common equity and is calculated by dividing operating income (loss) for the | ||||||||||||||
| ||||
AXIS Capital’s 2020 financial results for these performance metrics on an absolute basis are set forth below:
(2)"Adjusted OROACE" is operating return on adjusted common equity and is calculated by dividing operating income (loss) for the period by the common shareholders’ equity balance at the beginning of the period. Adjusted OROACE | |||||||||||
is a non-GAAP financial measure as defined in Item 10(e) of SEC Regulation S-K. The reconciliation to the most comparable GAAP financial measure, ROACE, | |||||||||||
| |||||||||||
|
|
|
| . | |||||||||||
|
| ||||||||||
| |||||||||||
(3)"ROACE" is return on average common equity and is calculated by dividing income (loss) available (attributable) to |
| ||||||||||
| |||||||||||
| |||||||||||
| |||||||||||
| |||||||||||
| period. | |||||||||||
| (4)One-year Total Shareholder Return with dividends reinvested, sourced from Bloomberg. | ||||||||||
| |||||||||||
| ||
| ||
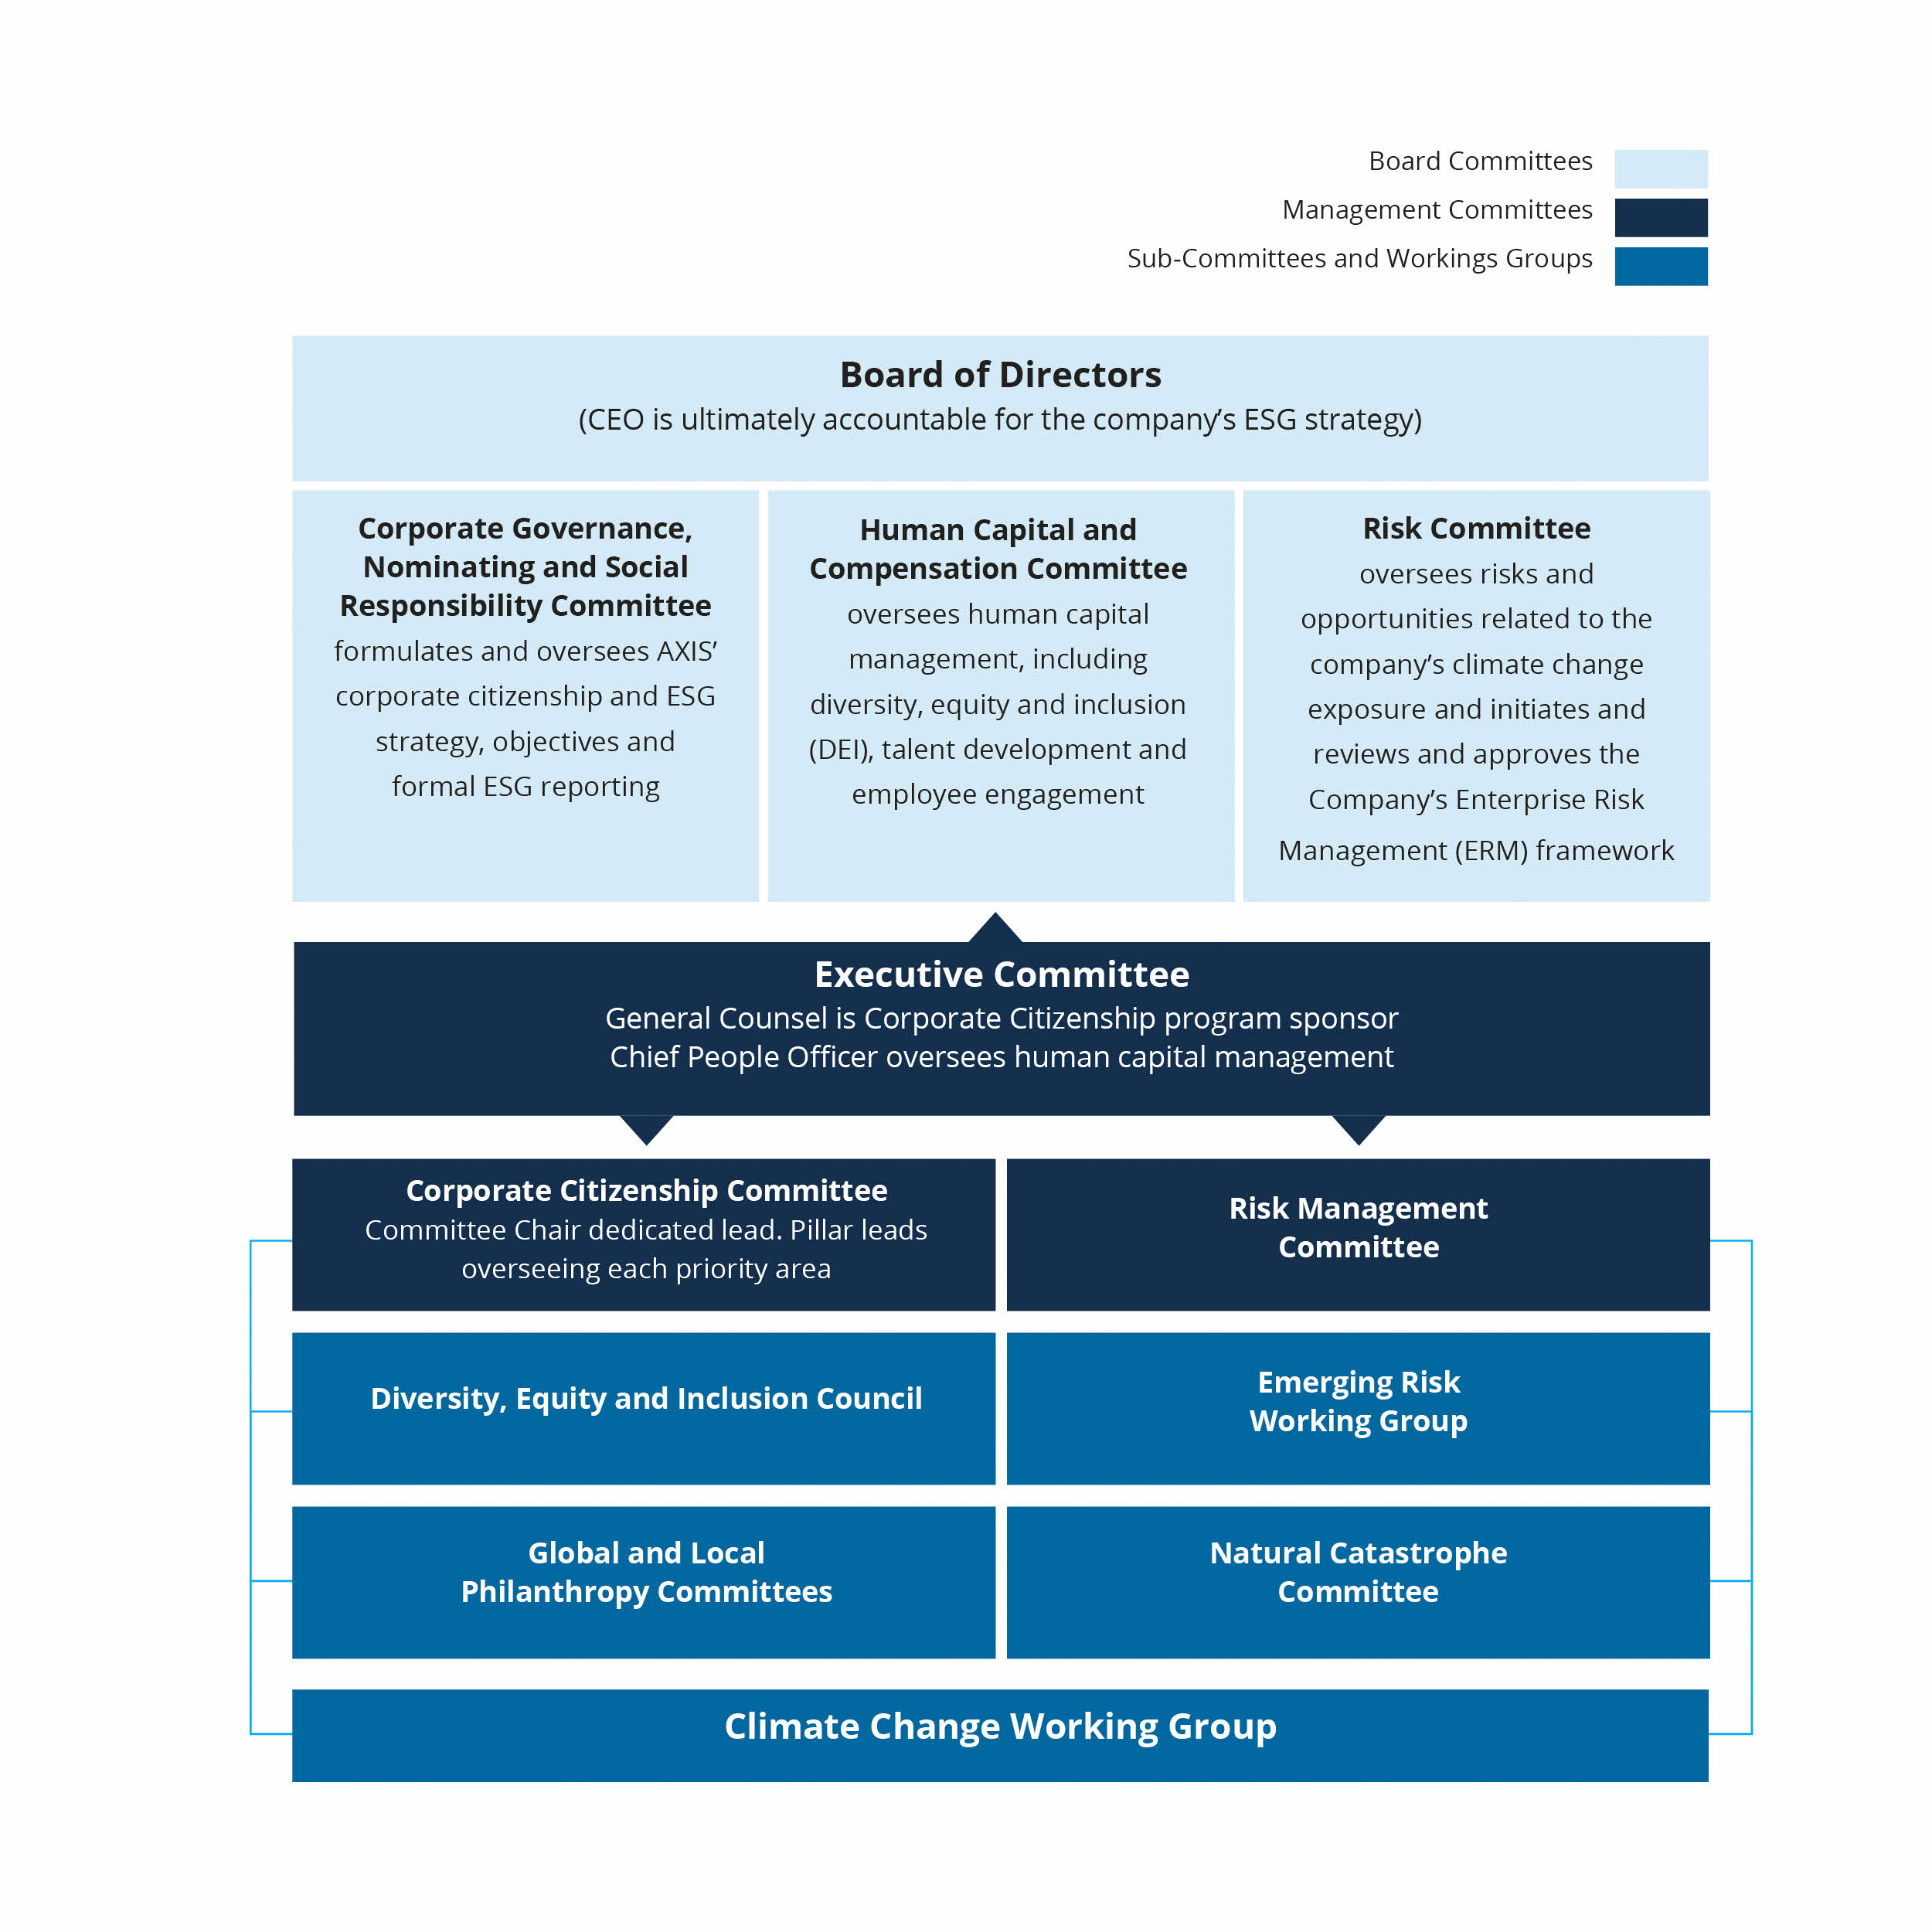
| Corporate Citizenship | At AXIS, our purpose is clear: by helping people and organizations around the world manage risk, we give them the confidence to pursue their goals and ambitions. Our Corporate Citizenship program, designed to address environmental, social and governance (ESG) factors and focusing on issues like the impact of climate change and diversity, equity and inclusion (DEI), is one of many ways we help advance this purpose. For more information on the Company’s corporate citizenship initiatives, see "Corporate Governance – Corporate Citizenship & Sustainability." | |||||||||||
| Human Capital Management | We believe our employees distinguish us from our competitors and are critical to our success as a focused specialty underwriter that leads with purpose. As a result, one of our core strategies is to invest in and support our employees, including with respect to health, safety and wellness, DEI, talent development, employee engagement and compensation and benefits. For additional information on our human capital management, please refer to "Corporate Governance – Human Capital Management." | |||||||||||
| Leadership Transition | In December 2022, the Board of Directors implemented a leadership transition, appointing Vincent Tizzio as President and CEO effective May 4, 2023, at which time he will also join the Board. The Board determined that Mr. Tizzio is the right person to lead the organization following our recent transformation due to Mr. Tizzio's deep industry and underwriting expertise in specialty insurance and his ability to further enhance the Company's ability to attract top-tier talent. In addition, the Company announced other senior leadership changes as discussed in "Compensation Discussion and Analysis – Leadership Transition." The Board believes that Mr. Tizzio, together with the rest of the leadership team, is well positioned to execute the Company's strategic imperatives and deliver sustainable profitable growth and increased shareholder value. For more information regarding compensation matters related to AXIS' leadership transition, see "Compensation Discussion and Analysis." | |||||||||||
| |||||||||
| 2 | PROXY STATEMENT SUMMARY | | |||||||
| Executive Compensation | Key compensation actions for 2022 include: •Paid/accrued severance in accordance with existing contracts relating to non-renewal and termination without cause. •Awarded equity to CEO at below target; other NEOs awarded equity at target. Paid bonuses in line with formula, averaging a payout of 107% of target. •For more information on executive compensation, see "Compensation Discussion and Analysis" and "Executive Compensation." | |||||||
| Corporate Governance Highlights | Corporate governance continues to be an area of significant focus for our Board. Our current governance practices include the following, many of which are discussed in further detail throughout this proxy statement: •Regular shareholder engagement •Annual Board and committee self-evaluations •Majority independent Board and fully independent Audit, Human Capital and Compensation, and Corporate Governance, Nominating and Social Responsibility Committees •None of our directors serve on the board of directors of more than three other publicly-held corporations •Majority vote standard for election of directors •No stockholder rights plan (“poison pill”) •Shareholders holding 10% or more of our outstanding stock have the right to call a special meeting | |||||||
Regular shareholder engagement
Annual Board and committee self-evaluations
Majority independent Board and fully independent Audit, Compensation and Corporate Governance and Nominating Committees
None of our directors serve on the board of directors of more than three other publicly-held corporations
Majority vote standard for election of directors
No stockholder rights plan (“poison pill”)
Shareholders holding 10% or more of our outstanding stock have the right to call a special meeting
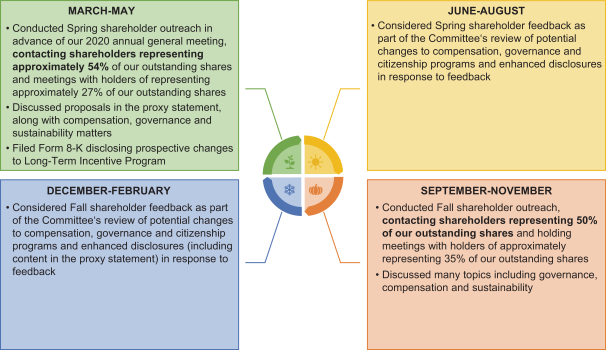
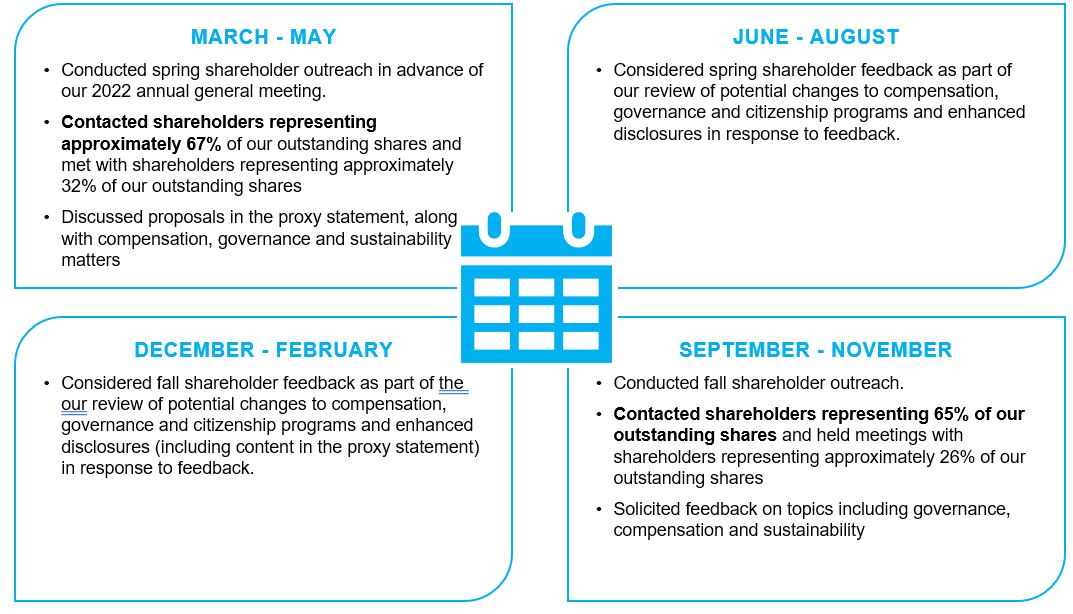
| Shareholder Engagement and Responsiveness to Shareholders | In addition to our regular investor relations efforts, in 2022 we •Henry Smith, our 2022 Human Capital and Compensation Committee Chair and independent Chair of the Board led engagement efforts and actively participated in all of the •Discussion topics included AXIS' strategy, executive compensation and governance practices as well as environmental, social and sustainability topics. For more information on shareholder engagement, see "Compensation Discussion and Analysis – Executive Summary – Positive 2022 Say on Pay Vote and Shareholder Engagement." | |||||||
Henry Smith, our Compensation Committee Chairman, who also served as our Lead Independent Director until his appointment as our independent Chairman, actively participated in a majority of the meetings.
During the meetings, we discussed our executive compensation and governance practices as well as environmental, social and sustainability topics.
Responding to shareholder feedback, changes were made to our compensation program as summarized in “Evolution of our Compensation Program” above and discussed in further detail in “Compensation Discussion and Analysis—Executive Summary, Shareholder Engagement and Responsiveness to 2020 Say on Pay Vote.”
Prompt return of your proxy will help reduce the costs of re-solicitation.
| ||||||||
| PROXY STATEMENT SUMMARY | |||||||
| ||||||||||
| PROPOSAL 1. ELECTION OF DIRECTORS | | |||||||||
| DIRECTORS |  |
|  |  |  |  |  |  |  |  |  | ||||||||||||||||||||||||||||||||||||||||||||
EXPERIENTIAL CRITERIA (1) | |||||||||||||||||||||||||||||||||||||||||||||||||||||||
Public Company Experience |
| ✓ |
| ✓ |
| ✓ |
| ✓ |
| ✓ |
| ✓ |
| ✓ |
| ✓ |
| ✓ |
| ✓ |
| ✓ | |||||||||||||||||||||||||||||||||
Digital Experience |
| ✓ |
| ✓ |
| ✓ | |||||||||||||||||||||||||||||||||||||||||||||||||
Insurance Experience |
| ✓ |
| ✓ |
| ✓ |
| ✓ |
| ✓ |
| ✓ |
| ✓ |
| ✓ | |||||||||||||||||||||||||||||||||||||||
Reinsurance Experience |
| ✓ |
| ✓ |
| ✓ |
| ✓ |
| ✓ | |||||||||||||||||||||||||||||||||||||||||||||
Finance Experience |
| ✓ |
| ✓ |
| ✓ |
| ✓ |
| ✓ |
| ✓ |
| ✓ |
| ✓ |
| ✓ |
| ✓ |
| ✓ | |||||||||||||||||||||||||||||||||
International Experience |
| ✓ |
| ✓ |
| ✓ |
| ✓ |
| ✓ |
| ✓ |
| ✓ |
| ✓ |
| ✓ | |||||||||||||||||||||||||||||||||||||
Banking Experience |
| ✓ |
| ✓ |
| ✓ |
| ✓ |
| ✓ |
| ✓ | |||||||||||||||||||||||||||||||||||||||||||
Legal/Regulatory Experience |
| ✓ |
| ✓ |
| ✓ | |||||||||||||||||||||||||||||||||||||||||||||||||
COMPOSITION | |||||||||||||||||||||||||||||||||||||||||||||||||||||||
Other Current U.S.-Listed Public Boards |
| 1 |
| 0 |
| 2 |
| 0 |
| 0 |
| 3 |
| 0 |
| 0 |
| 0 |
| 2 |
| 2 | |||||||||||||||||||||||||||||||||
Average Age = 64.5 years |
| 68 |
| 63 |
| 72 |
| 62 |
| 48 |
| 62 |
| 77 |
| 72 |
| 63 |
| 61 |
| 62 | |||||||||||||||||||||||||||||||||
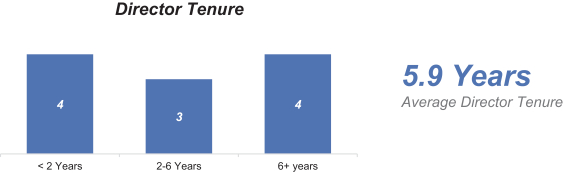
Average Tenure = 5.9 years |
| .8 |
| 9 |
| 18 |
| 1.3 |
| 2.3 |
| 0 |
| 11.7 |
| 16.9 |
| 0 |
| 2.8 |
| 2 | |||||||||||||||||||||||||||||||||
Racially/Ethnically Diverse |
| ◾ | |||||||||||||||||||||||||||||||||||||||||||||||||||||
Gender Diverse |
| ◾ |
| ◾ |
| ◾ |
| ◾ | |||||||||||||||||||||||||||||||||||||||||||||||
|
DIRECTORS(1) | Becker | Davis | Dowling | Hardwick | Millegan | Ramey | Smith | Theis | Tizzio | Yastine | Zlatkus | ||||||||||||||||||||||||
EXPERIENTIAL CRITERIA (1) | |||||||||||||||||||||||||||||||||||
| Public Company Experience | ✓ | ✓ | ✓ | ✓ | ✓ | ✓ | ✓ | ✓ | ✓ | ✓ | ✓ | ||||||||||||||||||||||||
| Digital Experience | ✓ | ✓ | ✓ | ||||||||||||||||||||||||||||||||
| Insurance Experience | ✓ | ✓ | ✓ | ✓ | ✓ | ✓ | ✓ | ✓ | ✓ | ||||||||||||||||||||||||||
| Reinsurance Experience | ✓ | ✓ | ✓ | ✓ | ✓ | ✓ | |||||||||||||||||||||||||||||
| Finance Experience | ✓ | ✓ | ✓ | ✓ | ✓ | ✓ | ✓ | ✓ | ✓ | ✓ | |||||||||||||||||||||||||
| International Experience | ✓ | ✓ | ✓ | ✓ | ✓ | ✓ | ✓ | ✓ | ✓ | ||||||||||||||||||||||||||
| Banking Experience | ✓ | ✓ | ✓ | ✓ | ✓ | ||||||||||||||||||||||||||||||
| Legal/Regulatory Experience | ✓ | ✓ | ✓ | ||||||||||||||||||||||||||||||||
| COMPOSITION | |||||||||||||||||||||||||||||||||||
| Other Current U.S.-Listed Public Boards | 1 | 1 | 0 | 0 | 2 | 0 | 0 | 0 | 0 | 3 | 1 | ||||||||||||||||||||||||
| Average Age = 65.7 years | 70 | 74 | 64 | 50 | 64 | 79 | 74 | 65 | 56 | 63 | 64 | ||||||||||||||||||||||||
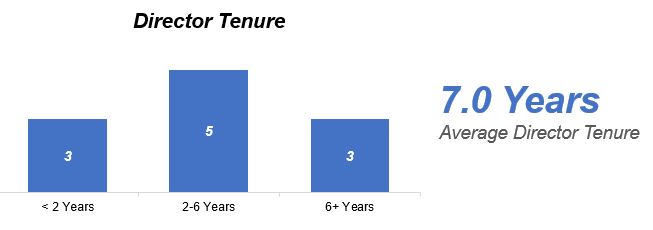
| Average Tenure = 7.0 years | 2.8 | 21.3 | 3.2 | 4.4 | 1.9 | 13.7 | 18.9 | 2.0 | - | 4.7 | 4.0 | ||||||||||||||||||||||||
| Racially/Ethnically Diverse | = | ||||||||||||||||||||||||||||||||||
| Gender Diverse | = | = | = | = | |||||||||||||||||||||||||||||||
Emphasizesprocess emphasizes the importance of diversity;diversity, including diversity of race, gender identity, age, sexual orientation, ethnicity and
Focuses national origin, geographic location and cultural background. Our process is also focused on expanding the collective skills and experience of our Board with our new directors bringing deep industry and financial expertise, regulatory experience, innovative thinking and strategic perspective.
| ||||||||
| PROPOSAL 1. ELECTION OF DIRECTORS | |||||||
The
| ||||||||
| 6 | PROPOSAL 1. ELECTION OF DIRECTORS | |||||||
| Name | Age | Class | Position | Since | ||||||||||
W. Marston Becker(1) | 70 | II | Independent Director | June 2020 | ||||||||||
Michael Millegan(1) | 64 | II | Independent Director | April 2021 | ||||||||||
| Thomas C. Ramey | 79 | II | Independent Director | July 2009 | ||||||||||
| Lizabeth H. Zlatkus | 64 | II | Independent Director | March 2019 | ||||||||||
W. Marston Becker | ||||||||
 | Experience: •Served as Chairman of the Board of QBE Insurance Group from 2014 until April 2020. •Served as Chairman and Chief Executive Officer of Alterra Capital Holdings Limited from 2006 to 2013, Trenwick Group, Ltd. from 2002 to 2005, the run-off for LaSalle Re Holdings from 2002 to 2008 and Orion Capital Corporation from 1996 to 2000. •Served as President and Chief Executive Officer of McDonough Caperton Insurance Group, Inc. from 1987 to 1994. •Holds the Chartered Financial Analyst designation and is an admitted attorney in West Virginia. Education: B.A. from West Virginia University and J.D. from West Virginia University U.S. Public Company Boards:MVB Financial Corp. Key Qualifications: The Board believes that Mr. Becker is qualified to serve as a director based on his 37 years of experience, including Chief Executive Officer and Chairman leadership positions in the insurance and financial industries. Committee Membership: Chair of the Risk Committee and Member of the Executive and Human Capital and Compensation Committees | |||||||
| ||||||||
| PROPOSAL 1. ELECTION OF DIRECTORS | 7 | |||||||
| Michael Millegan | ||||||||
 | Experience: •Has served as Founder and Chief Executive Officer of Millegan Advisory Group-3 LLC, a strategic advisory firm for early-stage companies since February 2014. •Held executive leadership and management roles at Verizon over the course of his 33-year tenure in the areas of digital technology and platforms, cybersecurity, supply chain management, sales, marketing and operations, including President of Verizon Global Wholesale Group, President of Verizon Digital Media Service, Area President of Verizon Midwest Region and Senior Vice President of Verizon Enterprise Operations. Education:B.A. from Angelo State University and M.B.A. from Angelo State University U.S. Public Company Boards:Portland General Electric Company and Wireless Telecom Group, Inc. Former director of CoreSite Realty Corporation from February to December 2021 prior to its acquisition by American Tower Corporation. Key Qualifications: The Board believes that Mr. Millegan is qualified to serve as a director based on his 33 years of leadership experience, including his experience running a business to business network and working with global companies, along with his knowledge in the areas of digital technology and platforms, cybersecurity, supply chain management, sales, marketing and operations. Committee Membership: Chair of the Human Capital and Compensation Committee and Member of the Finance Committee | |||||||
| Thomas C. Ramey | ||||||||
 | Experience: •Former Chairman and President of Liberty International, a wholly owned subsidiary of Liberty Mutual Group, from 1997 to 2009. Also served as Executive Vice President of Liberty Mutual Group from 1995 to 2009. •Served as President and Chief Executive Officer of American International Healthcare, a subsidiary of AIG, from 1986 to 1992. •Founder and President of an international healthcare trading company, including health maintenance organization (HMO) consulting and management. Education: B.A. from Texas Tech University and M.A. from Tulane University U.S. Public Company Boards:Former director of UroCor, Inc. from 1996 to 2001 prior to its acquisition by Dianon Systems Inc. Key Qualifications: The Board believes that Mr. Ramey is qualified to serve as a director based on his extensive insurance industry knowledge and significant background in international insurance operations, acquisitions and management. Committee Membership: Member of the Audit Committee and Corporate Governance, Nominating and Social Responsibility Committee | |||||||
| ||||||||||||
|
| Lizabeth H. Zlatkus | ||||||||||||
 | | |||||||||||
| Experience: |
Current Chief Executive Officer of Stone Point Capital LLC, serving since June 2005.
From 1998 until May 2005, held various executive positions at MMC Capital, Inc., a subsidiary of Marsh & McLennan Companies, Inc., serving as the Chief Executive Officer from 1999 to 2005 and as Chairman from 2002 to 2005. Also served as a Vice Chairman of Marsh & McLennan Companies, Inc. from 1999 to November 2004.
Spent 23 years at Goldman Sachs & Co. LLC, where, among other positions, Mr. Davis served as head of Investment Banking Services worldwide; head of the Financial Services Industry Group; General Partner; Senior Director; and Limited Partner.
•Served in various senior leadership positions during her tenure with The Hartford Financial Services Group from 1983 to 2011, including Chief Financial Officer and Chief Risk Officer of the Education:B.S. from |
| Pennsylvania State University U.S. Public Company Boards: |
| Boston Private Financial Holdings, Inc. from 2015 to 2021. Key Qualifications:The Board believes that Committee Membership:Chair of |
|
Former Chief Digital Officer of UBS, leading the bank’s innovation and digitization activities across all business lines and functions globally, serving from 2018 to June 2020.
Served as Head of Innovation of Deutsche Bank from 2016 to 2018, leading innovation across business lines and functions globally and supporting the company’s digital strategy development.
From 2011 to 2016, served as Chief Executive Officer of Credit Benchmark Ltd., a FinTech start-up and provider of credit risk data, leading the company from its foundation.
Held a succession of senior leadership positions at Thomson Reuters from 2005 to 2011 including Global Head of Strategy, Investment and Advisory; Global Head of Professional Publishing; and Head of Strategy for Europe and Asia.
Held positions at Morgan Stanley International from 2002 to 2005; Booz-Allen & Hamilton from 1997 to 2000; and the United Kingdom’s Department of Trade and Industry from 1995 to 1997.
Education: M.A. from the University of Cambridge and M.B.A. from Harvard Business School
| ||||
|
Served in various management roles during his distinguished 33-year career with Allianz SE, including as a member of the Allianz Board of Management from 2015 to 2020; Chief Executive Officer of Allianz Global Corporate & Specialty SE from 2006 to 2014; and Chief Executive Officer of Allianz Global Risks Ruckversicherungs from 2004 to 2006.
Also served on Allianz’s U.K. subsidiary board as Chairman from 2015 to 2018, as a member of the U.S. and Irish subsidiaries of Allianz from 2015 to 2018 and as Chairman of Allianz’ French credit insurance company, Euler Hermes from 2015 to 2019.
|
Former Chair and Chief Executive Officer of Ally Bank, a digital banking leader. Served as Chair from 2010 to 2015 and became interim Chief Executive Officer and President in 2011 before serving as Chief Executive Officer and President beginning in 2012. Also served as Chief Administrative Officer of Ally Financial from 2010 to 2012.
Previously served on the Board of First Data Corporation from 2016 to July 2019 and also as a director and co-Chief Executive Officer of privately held Lebenthal Holdings, LLC from September 2015 to June 2016. In November 2017, Lebenthal and certain of its subsidiaries filed voluntary petitions for bankruptcy under Chapter 7 of the United States Bankruptcy Code in the U.S. Bankruptcy Court for the Southern District of New York.
Held various executive roles at Citigroup and Credit Suisse First Boston spanning over 17 years.
Recommendation of the Board
| ||||||||||
| PROPOSAL 1. ELECTION OF DIRECTORS | | 9 | ||||||||
| Name | Age | Class | Position | Since | ||||||||||
Vincent C. Tizzio(1) | 56 | III | Chief Executive Officer and President | May 2023 | ||||||||||
| Charles A. Davis | 74 | I | Independent Director | November 2001 | ||||||||||
| Anne Melissa Dowling | 64 | III | Independent Director | January 2020 | ||||||||||
| Elanor R. Hardwick | 50 | I | Independent Director | November 2018 | ||||||||||
| Henry B. Smith | 74 | III | Independent Director | May 2004 | ||||||||||
| Axel Theis | 65 | I | Independent Director | April 2021 | ||||||||||
| Barbara A. Yastine | 63 | I | Independent Director | July 2018 | ||||||||||
| Vincent C. Tizzio | ||||||||
 | Experience: •Serves as our CEO Specialty Insurance and Reinsurance and will become our President and Chief Executive Officer, effective May 4, 2023. Prior to becoming CEO Specialty Insurance and Reinsurance, served as a Senior Advisor - Insurance Market Strategy from January 2022 to June 2022. •Served as Executive Vice President and Head of Global Specialty at The Hartford from May 2019 through August 2021. •Prior to joining The Hartford, Mr. Tizzio spent seven years as President and CEO of Navigators Management Company. Education:B.S. from Adelphi University U.S. Public Company Boards:None Key Qualifications:The Board believes that Mr. Tizzio is qualified to serve as a director based on his deep knowledge of the specialty insurance industry and his proven track record of managing an insurance business, with a comprehensive understanding of underwriting and go to market strategies. Committee Membership: Member of Executive Committee, effective May 4, 2023 | |||||||
| ||||||||
| 10 | PROPOSAL 1. ELECTION OF DIRECTORS | |||||||
| Charles A. Davis | ||||||||||||||
 | Experience: •Current Chief Executive Officer | |||||||||||||
| of Stone Point Capital LLC, serving since June | ||||||||||||||
•Held various executive positions at MMC Capital, Inc., a subsidiary of Marsh & McLennan Companies, Inc., from 1998 until May 2005, serving as the Chief Executive Officer from 1999 to 2005 and as Chairman •Spent 23 years at Goldman Sachs & Co. LLC, where, among other positions, Mr. Education:B.A. from the |
|
|
Served as the Chief Executive Officer and President of W.P. Stewart & Co., Ltd. from May 2005 to March 2006.
Former Chief Executive Officer of the Bank of Bermuda Limited from March 1997 to March 2004.
Joined the Bank of Bermuda in 1973 serving in various senior positions including Executive Vice President and Chief Operations Officer; Executive Vice President Europe; and Senior Vice President and General Manager, Retail Banking.
| Columbia Business School U.S. Public Company |
| Boards:The Progressive Corporation. Former director of The Hershey Company from 2007 to 2021. Key |
|
Has served as our President and Chief Executive Officer since May 2012. He previously served as our Executive Vice President and Chief Financial Officer from January 2011 until May 2012.
Served as Executive Vice President and Chief Financial Officer of PartnerRe Ltd. from April 2000 through September 2010 and as Chief Executive Officer of PartnerRe Ltd.’s Capital Markets Group business unit from June 2007 through September 2010.
Prior to joining PartnerRe, Mr. Benchimol was Senior Vice President and Treasurer at Reliance Group Holdings, Inc. for 11 years and was previously with the Bank of Montreal from 1982 to 1989.
Committee Membership: Member of Finance Committee, Executive |
| Committee |
| ||||||||
|
Served as Chairman of the Board of QBE Insurance Group from 2014 until April 2020.
Served as Chairman and Chief Executive Officer of: Alterra Capital Holdings Limited from 2006 to 2013, Trenwick Group, Ltd. from 2002 to 2005, the run-off for LaSalle Re Holdings from 2002 to 2008 and Orion Capital Corporation from 1996 to 2000.
Served as President and Chief Executive Officer of McDonough Caperton Insurance Group, Inc. from 1987 to 1994.
Holds the Chartered Financial Analyst designation and is an admitted attorney in West Virginia.
Anne Melissa Dowling | ||||||
Served as Director of Insurance for the State of Illinois from 2015 to 2017 and as Deputy Commissioner of Insurance for the State of Connecticut from 2011 to 2015.
Held executive management roles in the areas of investments, treasury, strategic planning and marketing and governance at Massachusetts Mutual Financial Group; Connecticut Mutual Life Insurance Company; Travelers Insurance Company; and at Aetna Life & Casualty, where she began her career in 1982.
Holds the Chartered Financial Analyst designation.
 | Experience: •Served as Director of Insurance for the State of Illinois from 2015 to 2017 and as Deputy (and Acting) Commissioner of Insurance for the State of Connecticut from 2011 to 2015. •Held executive management roles in the areas of investments, treasury, strategic planning and marketing and governance at Massachusetts Mutual Financial Group; Connecticut Mutual Life Insurance Company; Travelers Insurance Company; and at Aetna Life & Casualty, where she began her career in 1982. •Holds the Chartered Financial Analyst designation. Education:B.A. from Amherst College and M.B.A. from Columbia Business School |
U.S. Public Company |
Key Committee Membership: Chair of Finance Committee and Member of Risk Committee |
| ||||||||
| PROPOSAL 1. ELECTION OF DIRECTORS | 11 | |||||||
| Elanor R. Hardwick | ||||||||
 | Experience: •Former Chief Digital Officer of UBS, leading the bank’s innovation and | |||||||
|
Serves as Founder and Chief Executive Officer of Millegan Advisory Group-3 LLC, a strategic advisory firm for early-stage companies.
Held executive leadership and management roles at Verizon over the course of his 33-year tenure, including President of Verizon Global Wholesale Group, Area President of Verizon Midwest Region and Senior Vice President of Verizon Enterprise Operations.
•Served as Head of Innovation of Deutsche Bank from 2016 to 2018, leading innovation across business lines and functions globally and supporting the company’s digital strategy development. •Served as Chief Executive Officer from 2011 to 2016, of Credit Benchmark Ltd., a FinTech start-up and provider of credit risk data, leading the company from its foundation. •Held a succession of senior leadership positions at Thomson Reuters from 2005 to 2011 including Global Head of Strategy, Investment and Advisory; Global Head of Professional Publishing; and Head of Strategy for Europe and Asia. •Held positions at Morgan Stanley International from 2002 to 2005; Booz-Allen & Hamilton from 1997 to 2000; and the United Kingdom’s Department of Trade and Industry from 1995 to 1997. Education:M.A. from the University of Cambridge and M.B.A. from |
| Harvard Business School U.S. Public Company |
Boards:None |
| Henry B. Smith | ||||||||
 | Experience: •Served as the Chief Executive Officer and President of W.P. Stewart & Co., Ltd. from May 2005 to March 2006. •Former Chief Executive Officer of the Bank of Bermuda Limited from March 1997 to March 2004. •Joined the Bank of Bermuda in 1973 serving in various senior positions including Executive Vice President and Chief Operations Officer; Executive Vice President Europe; and Senior Vice President and General Manager, Retail Banking. Education:B.A. from Trinity College-Hartford U.S. Public Company Boards:None Key Qualifications:The Board believes that Mr. Committee Membership:Chair of Executive Committee | |||||||
| ||||||||
| 12 | PROPOSAL 1. ELECTION OF DIRECTORS | |||||||
| Axel Theis | ||||||||
 | Experience: •Served in various management roles during his distinguished 33-year career with Allianz SE, including as a member of the Allianz Board of Management from 2015 to 2020; Chief Executive Officer of Allianz Global Corporate & Specialty SE from 2006 to 2014; and Chief Executive Officer of Allianz Global Risks Ruckversicherungs from 2004 to 2006. •Also served on Allianz’s U.K. subsidiary board as Chairman from 2015 to 2018, as a member of the U.S. and Irish subsidiaries of Allianz from 2015 to 2018 and as Chairman of Allianz’ French credit insurance company, Euler Hermes from 2015 to 2019. Education:Ph.D. from the Eberhard Karls Universität Tübingen U.S. Public Company Boards:None Key Qualifications:The Board believes Dr. Theis is qualified to serve as a director based on his 33 years of Committee Membership:Member of Audit and Risk Committees | |||||||
| Barbara A. Yastine | ||||||||
 | Experience: •Former Chair and Chief Executive Officer of Ally Bank, a digital banking leader. Served as Chair from 2010 to 2015 and became interim Chief Executive Officer and President in 2011 before serving as Chief Executive Officer and President beginning in 2012. Also served as Chief Administrative Officer of Ally Financial from 2010 to 2012. •Previously served on the Board of First Data Corporation from 2016 to July 2019 and also as a director and co-Chief Executive Officer of privately held Lebenthal Holdings, LLC from September 2015 to June 2016. In November 2017, Lebenthal and certain of its subsidiaries filed voluntary petitions for bankruptcy under Chapter 7 of the United States Bankruptcy Code in the U.S. Bankruptcy Court for the Southern District of New York. •Held various executive roles at Citigroup and Credit Suisse First Boston spanning over 17 years. Education:B.A. in Journalism from New York University and M.B.A. from New York University U.S. Public Company Boards:Primerica, Inc., Zions Bancorporation and Alkami Technology, Inc. Key Qualifications:The Board believes that Ms. Yastine is qualified to serve as a director based on her more than 30 years of management experience in the financial services and risk management sectors, including her prior role as Chair, Chief Executive Officer and President of Ally Bank. Committee Membership:Chair of the Corporate Governance, Nominating and Social Responsibility Committee and Member of the Audit Committee | |||||||
| ||||||||
| PROPOSAL 1. ELECTION OF DIRECTORS | | 13 | ||||||
| ||||||||
| Albert A. Benchimol | ||||||||
 | Experience: •Has served as our President and | |||||||
•Served as Executive Vice President and |
|
Former Chairman and President of Liberty International, a wholly owned subsidiary of Liberty Mutual Group, from 1997 to 2009. Also served as Executive Vice President of Liberty Mutual Group from 1995 through 2009.
Served as President and Chief Executive Officer of American International Healthcare, a subsidiary of AIG.
Founder and President of an international healthcare trading company.
•Prior to joining PartnerRe, Mr. Benchimol was Senior Vice President and Treasurer at Reliance Group Holdings, Inc. for 11 years and was previously with the Bank of Montreal from 1982 to 1989. Education:B.S. from McGill University and |
U.S. Public Company |
Key |
|
Served in various senior leadership positions during her tenure with The Hartford Financial Services Group from 1983 to 2011, including Chief Financial Officer and Chief Risk Officer of the firm and Co-President of Hartford Life Insurance Companies and as Executive Vice President of The Hartford’s international operations and the group life and disability divisions.
Education: B.S. from Pennsylvania State University
Committee Membership: Member of Executive Committee |
| ||||||||
| PROPOSAL 1. ELECTION OF DIRECTORS | |||||||
✓ Regular shareholder engagement. We regularly engage with our shareholders to better understand their perspectives.✓ Regular Board and Committee self-evaluation process✓ Active Board refreshment process✓ No hedging the economic risk of owning AXIS stock or pledging of AXIS stock for loans or other obligations✓ Shareholders holding 10% or more of our outstanding stock have the right to call a special meeting
The Board also considers the recommendations of the Corporate Governance, Nominating and Social Responsibility Committee which thoughtfully assesses independence on an annual basis, regularly tracks and considers fees paid to Stone Point Capital LLC and its affiliates ("Stone Point") and other factors as well as the advice of outside counsel experienced in these matters.
| ||||||||
| CORPORATE GOVERNANCE | 15 | |||||||
| ||||||
Related persons include any of our directors, director nominees or executive officers, certain of our shareholders and their respective immediate family members. A conflict of interest occurs when an individual’s private interest interferes, or appears to interfere, in any way with our interests.
During 2020, Mr. Butt, who served as our Chairman until his retirement in September 2020, received $400,000 in consulting fee payments pursuant Further, directors are requested to the termsdisclose any new conflicts of interest at each quarterly board meeting, and they are expected to recuse themselves from any matters involving a consulting agreement by andpotential conflict.
and affiliates of Stone Point, a private equity firm that specializes in the insurance and financial services industry, including owning several specialized investment managers. Charles A. Davis is the Chief Executive Officer of Stone Point.
Additionally, we have committed to invest $71 million to Stone Point’s private equity fund, Trident VIII L.P. In 2020, we paid $1.1 million in management fees to Stone Point in connection with our investment in Trident VIII L.P.
We also have approximately $38 million invested in the Freedom Consumer Credit Fund, LLC Series B, the manager of which is Freedom Financial Asset Management, LLC, an indirect subsidiary of Pantheon Partners, LLC.LLC (“Pantheon”). Investment funds managed by Stone Point own approximately 14.5% of Pantheon Partners, LLC.Pantheon. During 2020, management2022, fees paid to Freedom Financial Asset Management, LLC totaled $2$1.7 million.
In January 2021, we committed to invest $30
| ||||||||
| 16 | CORPORATE GOVERNANCE | |||||||
| Name | Audit | Compensation | Corporate Governance and Nominating | Finance | Risk | Executive | Independent Director | |||||||
| W. Marston Becker | Member | Member | Chair | Member | X | |||||||||
| Albert A. Benchimol | Member | Member | ||||||||||||
| Charles A. Davis | Chair | Member | Member | X | ||||||||||
| Anne Melissa Dowling | Member | Member | Member | Member | X | |||||||||
| Elanor R. Hardwick | Member | Member | Member | X | ||||||||||
| Michael Millegan | Member | Member | X | |||||||||||
| Thomas C. Ramey | Member | Member | Member | X | ||||||||||
| Henry B. Smith | Chair | Member | Chair | X | ||||||||||
| Axel Theis | Member | Member | X | |||||||||||
| Barbara A. Yastine | Member | Chair | Member | X | ||||||||||
| Lizabeth H. Zlatkus | Chair | Member | Member | X | ||||||||||
| 2020 Meetings | 10 | 9 | 5 | 5 | 4 | 0 | ||||||||
| ||||
| Name | Audit | Human Capital and Compensation | Corporate Governance, Nominating and Social Responsibility | Finance | Risk | Executive | Independent Director | ||||||||||||||||
| W. Marston Becker | Member | Chair | Member | X | |||||||||||||||||||
| Charles A. Davis | Member | Member | Member | X | |||||||||||||||||||
| Anne Melissa Dowling | Chair | Member | X | ||||||||||||||||||||
| Elanor R. Hardwick | Member | Member | X | ||||||||||||||||||||
| Michael Millegan | Chair | Member | X | ||||||||||||||||||||
| Thomas C. Ramey | Member | Member | X | ||||||||||||||||||||
| Henry B. Smith | Chair | X | |||||||||||||||||||||
| Axel Theis | Member | Member | X | ||||||||||||||||||||
| Vincent C. Tizzio | Member | ||||||||||||||||||||||
| Barbara A. Yastine | Member | Chair | X | ||||||||||||||||||||
| Lizabeth H. Zlatkus | Chair | Member | Member | X | |||||||||||||||||||
| 2022 Meetings | 8 | 8 | 6 | 4 | 4 | 0 | |||||||||||||||||
| ||||||||
| CORPORATE GOVERNANCE | 17 | |||||||
covenants and making recommendations to the Board concerning the Company's dividend policy.
| ||||||
The Board believes that the role of a Lead Independent Director can enhance effective governance. During Mr. Butt’s tenure as non-independent Chairman in 2020, Mr. Smith served as the Lead Independent Director. In September 2020, Mr. Smith was appointed as independent Chairman. In addition to presiding at executive sessions of the non-management directors as well as all meetings at which the Chairman is not present, the Lead Independent Director’s duties included:
providing input on meeting scheduling, agendas and information that is provided to the Board;
acting as a liaison between the independent directors and the former Chairman;
recommending, as appropriate, that the Board retain consultants who will report directly to the Board; and
consulting and communicating with major shareholders on a per-request basis.
Under the Company’s Corporate Governance Guidelines, the Company no longer requires a Lead Independent Director since Mr. Smith qualifies as an independent Chairman.
in connection with a broader effort to streamline committee membership.
| ||||||||
| 18 | CORPORATE GOVERNANCE | |||||||
•the name, age and business and residence addresses of the candidate;
•the principal occupation or employment of the candidate;
•the number of common shares or other securities of the Company beneficially owned by the candidate;
| ||||
•all other information relating to the candidate that is required to be disclosed in solicitations of proxies for election of directors pursuant to Regulation 14A under the Exchange Act; and
•the candidate’s written consent to be named in the proxy statement and to serve as a director if elected.
agendas.
| ||||||||
| CORPORATE GOVERNANCE | 19 | |||||||
| ||||||
employees, including our Chief Executive Officer and President, Chief Financial Officer and Global Corporate Controller, and are available on our website at www.axiscapital.com.www.axiscapital.com. We intend to disclose on our website any required amendment to, or waiver of, a provision of the Code of Business Conduct that applies to our Chief Executive Officer and President, our Chief Financial Officer or our Global Corporate Controller. In addition, waivers of the Code of Business Conduct for our directors and executive officers may be made only by our Board or the Corporate Governance, Nominating and NominatingSocial Responsibility Committee and will be promptly disclosed to shareholders on our website in accordance with the listing standards of the NYSE. All directors, officers and employees are required to certify their compliance with our Code of Business Conduct and Corporate Governance Guidelines annually.
plan.
of Directors and the Forbes 2022 America's Best Midsize Employers award.
Our Businessoperations, and Exposures – We believe that (re)insurers have an important role to play in mitigating climate risk, transitioning to a low-carbon economy and protecting our planet. In 2020, we continued to mitigate climate risk. In particular, our policy to limit thermal coal and oil sands underwriting and investment went into effect on January 1, 2020 and by year end, we committed to not underwrite new insurance or facultative reinsurance contracts, or provide investment support, for projects covering the exploration, production or transportation of oil and gas in the Arctic National Wildlife Refuge. As part of our commitment to transition to a low-carbon economy, we were proud to continue to be a top global player in the renewable energy insurance space – a line of business in which we continue to invest. We also completed an assessment report of climate risks acrosstrack our product lines and continued to advance and monitor the latest science on climate change through our NatCat Centre of Excellence, the AXIS Research Center at the University of Illinois, our global climate-change working group and local modeling teams. We also model and review peril regions most likely to be affected by climate risk.
Our Operations –GHG emissions. We completed a comprehensive assessment of our 20192020 and 2021 greenhouse gas emissions and plan to use the results of our assessmentwhich we used to inform our strategyGHG reduction goals related to mitigateScope 1 and Scope 2 emissions. In addition, we signed the Global Supply Chain Pledge launched by the Insurance Task Force of the Sustainable Markets Initiative to advance sustainable action in our supply chain.
| ||||||||
| 20 | CORPORATE GOVERNANCE | |||||||
| ||||||||
| CORPORATE GOVERNANCE | 21 | |||||||
| ||||||||
| 22 | CORPORATE GOVERNANCE | |||||||
| ||||||||
| CORPORATE GOVERNANCE | 23 | |||||||
Our Board, along with our Corporate Governance, Nominating and Social Responsibility Committee.
| ||||
A keyother senior executives, is responsible for ensuring that our ESG initiatives are consistent with our culture, values and business objectives.
AXIS established a Diversity & Inclusion Council comprised of global employees representing a full spectrum of experiences and viewpoints. The Council, in partnership with AXIS’ dedicated diversity, equity and inclusion lead, identifies, prioritizes and enacts annual diversity, equity and inclusion goals that are aligned and embedded in our corporate initiatives.recommendations. The Council is supported by an ancillary group of Diversity & InclusionDEI Advocates who actively engage and promote the work of the Council.
AXIS introduced various diversity, equity and inclusion educational initiatives, such as monthly “knowledge tests” on a range
We continuedcontributed to broaden our recruiting strategies to identify, recruit and develop a diverse pipeline of candidates. Recent initiatives include:
|
|
|
|
|
AXIS established quarterly measurement of diverse hiring, turnover, promotions, succession planning and candidate slates. In support of this work, AXIS also measures gender pay gap semi-annually and conducts annual pay audits. We also continued to partner with a human capital analytics firm that advises companies with respect to diversity, equity and inclusion metrics to help us set, track and consistently improve our diversity, equity and inclusion.
AXIS participated in the Bloomberg Gender Equality Index, an index of public companies committed to disclosing their efforts to achieve gender equality, to build greater parity between genders within our organization. This participation, in turn, earned AXIS inclusion in the 2021 Bloomberg Gender Equality Index.
Our Communities: Philanthropy
Our philanthropy strategy focuses on organizations that drive awareness and action important to our company, people, communities and industry. AXIS has a long history of supporting charitable causes that align with our values. Our giving comes in many forms:
In 2020, AXIS donated $1 million to support COVID-19 relief efforts, including $100,000 to support underserved communities that have been particularly impacted by the pandemic.
Each year we host a Global Giving Rally, a period of time when colleagues can use paid time off to volunteer at local organizations. We also offer one additional paid day off to volunteer at any point during the year. In 2020, we shifted the initiative to a virtual setting.
As part of our investment in communities, AXIS sponsors a Matching Gifts Program, which is now in its thirteenth year of operation. In 2020, AXIS’ combined philanthropic activity supported over 570 non-profit organizations.
| ||||||
Our Voice: Advocacy
AXIS focuses its advocacy efforts on driving significant change in the (re)insurance industry by promoting issues, policies and initiatives that are supportive of our values, our corporate citizenship pillars and our stakeholders.
For example, in terms of environmental and climate change advocacy:
AXIS continues to partner with leading researchers and students at the University of Illinois’ Office of Risk Management and Insurance Research. This partnership is creating new natural catastrophe risk conceptualization models that leverage data analytics and computer programming.
AXIS partnered with AIR Worldwide and scholars from the Brookings Institution to publish “Quantifying the Impact from Climate Change on U.S. Hurricane Risk,” a research study addressing how climate change may affect hurricane risk in the United States by 2050, specifically related to residential and commercial properties. This paper included information from University of Illinois research fellows funded by AXIS.
We expanded our work with the Insurance Development Forum (“IDF”), a public-private partnership that seeks to optimize and extend the use of insurance to address social, economic and environmental issues. We joined additional IDF working groups, including the Sovereign & Humanitarian Solutions working group, which focuses on the development of new insurance solutions for sovereigns, sub-sovereigns, international institutions and humanitarian agencies. We continue to play a leadership role as our CEO, Albert Benchimol, serves on the IDF Steering Committee; and
AXIS remains a member of the Bermuda Institute of Ocean Sciences’ Risk Prediction Initiative, which was formed in the wake of Hurricane Andrew in 1992. The Risk Prediction Initiative was formed in part to improve models for natural catastrophes and better estimate probable loss distributions.
In terms of diversity and inclusion advocacy:
AXIS participated in the 2020 Lloyd’s Dive In festival, an initiative focused on diversity, equity and inclusion in the insurance industry, by sponsoring and participating in local committees in Atlanta, Bermuda, London, New York City and Zurich.
|
employees.
| ||||
| ||||||||
| 24 | CORPORATE GOVERNANCE | |||||||
In 2022, on average 80% of employees participated in our biannual employee surveys. We are proud to have maintained strong survey engagement and scores in a year of organizational change.Employee EngagementWe understand that employee engagement leads to a more satisfying and fulfilling workplace and motivates employees to do their best work. Our employee engagement initiatives include: (i) AXIS Applause (our global recognition program to recognize the contributions of other AXIS members)members and drive strong employee performance), (ii) community building events for AXIS employees and their families and (iii) our employee-led charitable giving program which helps our employees give back to their communities.During 2020, In addition, to provide an open and frequent line of communication between senior management and our employees, we conducted anhost all-employee calls led by our CEO on a monthly basis and we encourage our people managers to periodically check in with their employees.Each year we conduct two enterprise-wide engagement survey, measuring engagementsurveys to better understand and inclusion.improve the employee experience and identify opportunities to strengthen our culture. These surveys are conducted once in the spring and a second in the fall. Managers and teams reflectedreflect on the survey results and developeddevelop enterprise-wide and local action plans to address areas identified for growth.Compensation and BenefitsTo attract and retain our industry’s top talent, we offer employees a total rewards program that is designed to incentivize exceptional performance and deliver equal pay for equal work.performance. Our compensation packages align with our pay-for-performance philosophy and are assessed on an annual basis through year-end performance reviews. Our packages are also regularly benchmarked against similarly-sized specialty insurance, reinsurance and financial services companies in each of our talent markets.companies. Compensation components include market competitive salaries and short-term annual incentive programs (i.e., bonus payments) and, for senior level employees, long-term incentives such as equity grants. Our comprehensive benefits packages include medicalpaid time off, health and welfare plans for employees and their families, flexible spending accounts, retirement savings plans with employer contributions and work-life benefits, including parental leave policies, flexible work arrangements for eligible employees and charitable matching programs.At AXIS, we are committed to fair pay and delivering equal pay for equal work regardless of gender, race or other personal characteristics. In support of our commitment to equal pay practices, we conduct regular gender pay equity audits and take action to address any areas of concern. In addition, as discussed in "Corporate Citizenship & Sustainability," we have published the results of our global gender pay equity audits in connection with our participation in the Bloomberg Gender Equality Index.Succession PlanningWe have a robust talent and succession planning process. On an annual basis, management conducts a talent and succession plan for each member of our Executive Committee and their direct reports, focusing on high performing and high potential talent, diverse talent and the succession plan for each position. On an annual basis, our Board receives a comprehensive succession plan for each member of our Executive Committee. In light of the COVID-19 pandemic, in 2020, the Compensation Committee also received a report on the emergency succession plan for the Executive Committee.22CORPORATE GOVERNANCE 25
Employees
| North America (including Bermuda) | 1,295 | |||||||||
| ||||||||||
Europe, Middle East and Africa | ||||||||||
| 747 | ||||||||||
Asia Pacific | ||||||||||
| 22 | ||||||||||
Total employees | 2,064 | |||||||||
| Women | Men | |||
Total employees (1) | 43% | 55% | ||
|
| Women | Men | |||||||
Total employees(1) | 45% | 54% | ||||||
| ||
| ||
| ||
| ||
| ||
|
|
All U.S. Employees(1) | |||||||
| 16% | ||||||
| Asian | |||||||
| Hispanic / Latinx | 5% | ||||||
| White | |||||||
| Multiracial, Native American and Pacific Islander | 2% | ||||||
| No Response / Not Disclosed | 7% | ||||||
| Total employees | 100% | ||||||
| PRINCIPAL SHAREHOLDERS | |||||
• Each person or group known to us to be the beneficial owner of more than 5% of our common shares
• Each of our directors
• Each of our named executive officers
• All of our directors and executive officers as a group
| Directors and Executive Officers | Number of Common Shares (1) | Percent of Outstanding Common Shares (1) | ||||
Albert A. Benchimol | 409,131 | * | ||||
W. Marston Becker | 9,775 | * | ||||
Charles A. Davis (2) | 44,083 | * | ||||
Anne Melissa Dowling | 5,703 | * | ||||
Elanor R. Hardwick | 6,188 | * | ||||
Thomas C. Ramey | 15,552 | * | ||||
Henry B. Smith | 49,541 | * | ||||
Axel Theis |
| — |
| * | ||
Barbara A. Yastine | 8,337 | * | ||||
Lizabeth H. Zlatkus | 8,110 | * | ||||
Steve K. Arora | 52,186 | * | ||||
David S. Phillips | 36,858 | * | ||||
Peter J. Vogt | 38,724 | * | ||||
Peter W. Wilson | 54,850 | * | ||||
All directors and executive officers as a group (14 persons) (7) | 739,038 | * | ||||
| OTHER SHAREHOLDERS | ||||||
T. Rowe Price Associates, Inc. (3) | 10,682,555 | 12.6% | ||||
The Vanguard Group (4) | 7,518,425 | 8.9% | ||||
T-VIII PubOpps LP (5) | 6,777,086 | 8.0% | ||||
Pzena Investment Management, LLC (6) | 6,596,786 | 7.8% | ||||
| DIRECTORS AND EXECUTIVE OFFICERS | Number of Common Shares (1) | Percent of Outstanding Common Shares (1) | ||||||
| Albert A. Benchimol | 521,448 | * | ||||||
| W. Marston Becker | 14,190 | * | ||||||
Charles A. Davis (2) | 52,907 | * | ||||||
| Anne Melissa Dowling | 10,118 | * | ||||||
| Elanor R. Hardwick | 12,357 | * | ||||||
| Michael Millegan | 4,853 | * | ||||||
| Thomas C. Ramey | 19,967 | * | ||||||
| Henry B. Smith | 55,710 | * | ||||||
| Axel Theis | 5,296 | * | ||||||
| Barbara A. Yastine | 12,752 | * | ||||||
| Lizabeth H. Zlatkus | 16,483 | * | ||||||
| Peter J. Vogt | 56,104 | * | ||||||
| Vincent C. Tizzio | 11,429 | * | ||||||
| David S. Phillips | 52,608 | * | ||||||
| Conrad D. Brooks | 31,943 | * | ||||||
| Steve K. Arora | 33,788 | * | ||||||
| Peter W. Wilson | 6,999 | * | ||||||
All directors and executive officers as a group (16 persons) (3) | 881,159 | 1% | ||||||
| OTHER SHAREHOLDERS | ||||||||
T. Rowe Price Investment Management, Inc. (4) | 10,193,257 | 12.0% | ||||||
The Vanguard Group, Inc. (5) | 8,281,280 | 9.7% | ||||||
Pzena Investment Management, LLC (6) | 5,543,905 | 6.5% | ||||||
T-VIII PubOpps LP (7) | 6,777,806 | 8.0% | ||||||
|
|
|
|
| ||||||||||
| 27 | |||||||||
|
|
|
|
DELINQUENT SECTION 16(a) REPORTS
Under Section 16(a)
We believe that all of our directors, executive officers and shareholders who are requiredinformation set forth below is based solely on information contained in Amendment No. 9 to file reports filed all of such reports on a timely basis during 2020 except that, due to an administrative error, the Form 4 originally filed for Albert Benchimol on January 30, 2020 incorrectly reported the amount of restricted stock units awarded on January 28, 2020. An amended Form 4 wasSchedule 13G/A filed on February 4, 20209, 2023 by The Vanguard Group, Inc., 100 Vanguard Blvd., Malvern, PA 19355, and includes common shares beneficially owned as of December 31, 2022. Vanguard has sole dispositive power over 8,281,280 common shares. Vanguard has shared voting power over 48,177 common shares and shared dispositive power over 124,585 common shares.
| ||||||||
| PRINCIPAL SHAREHOLDERS | |||||||
| Name | Age | |||||||
Albert A. Benchimol (1) | 65 | Chief Executive Officer, President and Director | ||||||
| Peter J. Vogt | 59 | Chief Financial Officer | ||||||
Vincent C. Tizzio(2) | 56 | Chief Executive Officer, Specialty Insurance and Reinsurance | ||||||
| David S. Phillips | 54 | Chief Investment Officer | ||||||
| Conrad D. Brooks | 61 | General Counsel | ||||||
| 43 | |||||||
Peter J. Vogt | ||||||||
| ||||||||
| ||||||||
| ||||||||
|
Peter J. Vogt |
|
David S. Phillips | David S. Phillips joined AXIS as Chief Investment Officer in April 2014. With over 25 years of experience in investments, Mr. Phillips previously served as Head of Investments for |
| |||||
| Conrad D. Brooks | Conrad D. Brooks serves as General Counsel of AXIS Capital. Prior to his appointment to the role in January 2017, he served for nearly a decade as the Company’s Corporate Counsel. Mr. Brooks joined AXIS from McKenna Long & Aldridge LLP (now Dentons), where he was a partner and served as a practice team leader in the firm’s corporate and securities practice. A former officer in the United States Navy, Mr. Brooks received his B.S. from the University of Illinois, his J.D. from Georgia State University College of Law and his M.B.A. (Finance) from Old Dominion University. | ||||
| Daniel J. Draper | Daniel J. Draperwas appointed Group Chief |
| ||||||||||
| 29 | |||||||||
Process."
2024.
| PROPOSAL | ||||||||
LETTER FROM THE COMPENSATION COMMITTEE CHAIRMAN
Dear Fellow Shareholder,
OverIn accordance with the courserequirements of Section 14A of the past year, I hadExchange Act (which was added by the opportunityDodd-Frank Act) and the related rules of the SEC, we are including in the proxy statement a separate resolution subject to speak with manyshareholder vote to determine, in a non-binding vote, whether a shareholder vote to approve the compensation of you directly,our named executive officers (that is, votes similar to the non-binding vote in connection with our 2020 Annual Meeting and our fall outreach program. During these meetings, we discussed key topics, such as:
Our executive compensation practices, including changes made to our program to further align pay and performance;
Our Board composition, including diversity and skills criteria and
Environmental, social and other sustainability topics, such as diversity, equity and inclusion initiatives and human capital management;
Transparency in disclosuresof Directors has determined that an advisory vote on executive compensation that occurs every year is the most appropriate policy for AXIS at this time, and therefore our Board of Directors recommends that you vote for future advisory votes on executive compensation to occur annually.
The impact
| PROPOSAL 3. NON-BINDING VOTE ON THE FREQUENCY OF SHAREHOLDER VOTES ON EXECUTIVE COMPENSATION | | |||||||
| 30 | ||||||||
| LETTER FROM THE HUMAN CAPITAL AND COMPENSATION COMMITTEE CHAIRS | |||||
Performance and pay outcomes in 2020
Our financial results fell short of expectations in 2020. As During our 2022 outreach discussions, our shareholders continued to express strong support for our non-financial goals, the exceptional collaboration among our leadership team in the face of an extraordinary yearexecutive compensation philosophy and the degree of progress made on the Company’s long-term strategy was exemplary. However, given that our Chief Executive Officer is ultimately accountable for our financial results, the Compensation Committee felt it was important that his annual incentive non-financial performance payout not exceed 100%, resulting in a bonus equal to 30% of target. Despite the pay outcome, the Committee still recognizes the Chief Executive Officer’s excellent stewardshipprograms, and approximately 93% of the Company, redefiningvotes cast at our organizational culture and preparing the Company for future success during a year of unparalleled macro events.
Changes in2022 Annual General Meeting supported our executive compensation structure in 2020 and 2021
programs.
As detailed further in this proxy statement, the Compensation Committee made the following changes to our compensation program in 2020 and 2021:
Adjusted the annual incentive mix for our Chief Executive Officer to place a higher weighting on the Company’s OROACE results, effective with his 2020 incentive award.
Revised the PSU payout scale effectivewe welcome continued dialogue with our 2021 grants (for performance year 2020).
Increased the weighting of the Company’s OROACE in the annual incentive mix for all other NEOs, emphasizing the importance of group financial results (for performance year 2021).
How the Committee considered the impact of COVID-19 on executiveshareholders regarding AXIS' compensation
The Compensation Committee met several times to thoughtfully consider the impact of COVID-19 on our executive compensation program. The Committee sought to balance acknowledging the Company’s financial results, while recognizing our executives for their unwavering efforts and leadership throughout the pandemic. In consultation with Korn Ferry, the Committee determined:
No modifications would be made to the financial goals under our annual incentive plan or to the performance assessment of outstanding PSUs to account for the impact of COVID-19.
A modest adjustment was made to the non-financial annual incentive performance payout specific to each NEO to reflect their role in the Company’s response to the pandemic.
20% of each NEO’s annual incentive bonus will be delivered in RSUs that vest on a pro-rata basis over three years (in lieu of cash) consistent with the approach taken with other senior employees in our organization.
As you review the discussion and analysis of our compensation program in the proxy statement, I believe that you will find the actions taken in 2020 align with the interests of our shareholders and incentivize growth in the long-term. programs. Thank you for your continued support of AXIS.
support.

Chairman of the Board
(Former Chair, Human Capital and Compensation Committee Chair

| LETTER FROM HUMAN CAPITAL AND COMPENSATION COMMITTEE CHAIRS | |||||||
| 31 | |||||||
| Name | Page | |||||||
Leadership Transition | ||||||||
Company Performance | ||||||||
| Positive 2022 Say on Pay Vote and Shareholder Engagement | ||||||||
| Strong Link Between Pay and Performance | ||||||||
2022 Pay and Performance – CEO Compensation | ||||||||
The
| ||
| ||
| ||
| ||
| ||
In fiscal year 2020, AXIS faced the combination of severe catastrophe events and the global COVID-19 pandemic, making 2020 the fifth costliest catastrophe year on record, impacting our financial performance, as well as the industry overall. Nonetheless, fiscal year 2020 marked a year of significant progress in our core underwriting performance and portfolio optimization efforts. Despite our 2020 financial results, we believe AXIS enters 2021 with a stronger and more balanced book of business and is well-positioned for future profitable growth.
Company Performance
OROACEwas the financial metric used for evaluating cash bonus awards under our Annual Incentive Plan. Relative TSR was the Company’s financial metric for the PSUs granted in 2020.
AXIS Capital’s 2020 financial results for these performance metrics on an absolute basis are set forth below:
| ||
| ||
| ||
|
|
| Name | Title | ||||||
Albert A. Benchimol(1) | Chief Executive Officer and President | ||||||
| Peter J. Vogt | Chief Financial Officer | ||||||
Vincent C. Tizzio(2) | Chief Executive Officer, Specialty Insurance and Reinsurance | ||||||
| David S. Phillips | Chief Investment Officer | ||||||
| Conrad D. Brooks | General Counsel | ||||||
Steve K. Arora(3) | Former Chief Executive Officer, AXIS Reinsurance | ||||||
Peter W. Wilson(4) | Former Chief Executive Officer, AXIS Insurance | ||||||
(1)Mr. Benchimol will no longer serve as Chief Executive Officer, President and Director effective as of the close of business on May 4, 2023. He will serve as a strategic advisor through December 31, 2023. | |||||||
(2) Mr. Tizzio will succeed Mr. Benchimol as Chief Executive Officer and President effective as of the close of business on May 4, 2023. Mr. Tizzio became the CEO of AXIS Insurance on June 1, 2022 and transitioned to CEO, Specialty Insurance and Reinsurance, an expansion of his previous role, on June 7, 2022. | |||||||
(3) Mr. Arora departed AXIS on December 31, 2022. | |||||||
(4) Mr. Wilson departed AXIS on December 31, 2022. | |||||||
| ||||||||
| 32 | COMPENSATION DISCUSSION AND ANALYSIS | |||||||
Progress
Several years ago, we launchedMay 4, 2023, and thereafter, he will serve as a multiyear transformation program focused on delivering more proactive capital allocationstrategic advisor through December 31, 2023.
While COVID-19 and numerous catastrophe events impacted our financial performance. Despite a challenging backdrop of catastrophic events, such as the Russian-Ukraine war, severe weather, and the continued pandemic impact, we delivered solid financial results - highlighted by record premium production ($8.2 billion in FY 2022, compared to $7.7 billion in FY 2021) and improved underwriting metrics (combined ratio of 95.8% for the year, the challenging environment caused by the global pandemic did not change or slow the execution of our strategic priorities. Instead, it served as a catalystFY 2022 compared to further accelerate these initiatives. 97.5% for FY 2021).
Continuing
Delivered higher quality portfolio and reduced volatility, achieving record: $8.2 Billion Gross Premiums Written | Accelerated expansion as leading specialty insurer, with Insurance business growing: 15% We also repositioned our complementary reinsurance book in the specialist space in FY 2022. | |||||||
Delivered more agile and efficient organization. The Insurance segment’s Underwriting G&A Expense Ratio decreased: 2 pts 14.2% in 2022, compared to 16.2% in 2021. | Invested in high performing people and culture, advancing our ESG, DEI and engagement initiatives earning: Top Ranking In “Overall Commitment to ESG" in the Insurer's Lloyd’s 2022 ESG Survey and other recognitions. | |||||||
| ||||||||
| COMPENSATION DISCUSSION AND ANALYSIS | 33 | |||||||
| Measure | Fiscal Year 2022 | Change versus Fiscal Year 2021 | ||||||
OROACE (1) | 11.1% | +2.0% pts | ||||||
Adjusted OROACE(2) | 10.2% | N/A | ||||||
ROACE(3) | 4.3% | -7.9% pts | ||||||
Total Shareholder Return(4) | 2.6% | -9.2% pts | ||||||
(1) OROACE is a non-GAAP financial measure as defined in Item 10(e) of SEC Regulation S-K. The reconciliation to the most comparable GAAP financial measure, ROACE, along with a discussion of the rationale for the presentation, is provided in Appendix 1. | ||||||||
(2) Adjusted OROACE is a non-GAAP financial measure as defined in Item 10(e) of SEC Regulation S-K. The reconciliation to the most comparable GAAP financial measure, ROACE, along with a discussion of the rationale for the presentation, is provided in Appendix 1. | ||||||||
(3)One-year Total Shareholder Return with dividends reinvested, sourced from Bloomberg. | ||||||||
Scaling priority, high-growth business. We progressed digital offerings for attractive professional lines and progressed our capability to innovate around product offerings for micro customers.
Advancing automation and digitization processes. The Company took measures to scale in attractive businesses, reduce distribution and G&A costs over the long-term and focus underwriters on high value-added risk selection.
Progressing One AXIS, high performance culture. We progressed our high performance, One AXIS culture, improving employee engagement as measured in our enterprise-wide engagement survey and advancing our diversity, equity and inclusion initiatives.
POSITIVE 2020 SAY ON PAY VOTE AND SHAREHOLDER ENGAGEMENT
At our 20202022 Annual General Meeting, approximately 93%93.0% of the votes cast were in favor of our advisory vote on executive compensation.
| ||||||||||
| COMPENSATION DISCUSSION AND ANALYSIS | | |||||||||
What We Heard | What We Did | ||||||||||
Executive Compensation: Annual Incentive | Reward executives on achievement of financial goals and strategic objectives; provide clear disclosure around | For the CEO, maintained a 75% financial metric weighting and 25% weighting for non-formulaic metrics. For all other NEOs, increased the weighting of the Company’s |
| ||||||||
| |||||||||||
Executive Compensation: PSUs | Ensure that PSUs have a direct alignment with Company |
| Since the | ||||||||
The range of the payout scale will also remain at 0% to 200%. | |||||||||||
| ESG Disclosure | Publish additional ESG-related reports and expand climate-related disclosures. | In 2022, we published our inaugural Task Force on Climate-Related Financial Disclosure-aligned report, which discusses the impact of climate-related risks and opportunities on our business and strategy, climate risk management, climate-related governance within the Company and our climate-related metrics and targets. In addition, we have published our estimated Scope 1, Scope 2 and certain Scope 3 greenhouse gas emissions for fiscal years 2019 through 2021. | |||||||||
| ||||||||
| COMPENSATION DISCUSSION AND ANALYSIS | 35 | |||||||
| What We Heard | What We Did | |||||||
| GHG Reduction Goals | Publish emission reduction goals and advance climate change mitigation initiatives. | In support of its commitment to mitigate climate change and support the transition to a low-carbon economy, the Company published GHG emissions reduction goals. | ||||||
| Workforce Disclosure | Expand reporting of the Company's demographic metrics. | Beginning in 2022, we have disclosed quantitative metrics reflecting the gender, race and ethnicity of our workforce, as permitted by laws and regulations. | ||||||
| Board Oversight of ESG Matters | Explain Board and committee oversight of ESG. | We have formalized our Board and committee oversight of ESG as described below: Our Corporate Governance, Nominating and Social Responsibility Committee oversees our ESG and sustainability initiatives. In 2021, the Corporate Governance, Nominating and Social Responsibility Committee delegated oversight of human capital management, a component of the Company's ESG program, to the In connection with this change, the Corporate Governance, Nominating and Social Responsibility Committee, formerly known as the Corporate Governance and Nominating Committee, was renamed to formalize its primary responsibility for | ||||||
| Board Structure | Discuss rationale for the classified board structure. | The Board and the Corporate Governance, Nominating and Social Responsibility Committee engaged in a robust discussion on the appropriate board structure for the Company and its shareholders and will continue to consider the matter on an annual basis. See "Proposal 1. Election of Directors – Board Structure" for more information. | ||||||
COVID-19 COMPENSATION CONSIDERATIONS
In determining compensation for the 2020 performance year, the Compensation Committee did not modify the financial performance goals for the Annual Incentive Plan that were established at the beginning of the year, prior to the onset of COVID-19. As a result, the financial metric of the Annual Incentive Plan that relates to OROACE, resulted in a performance factor of 0%. Likewise, the Compensation Committee also did not modify or adjust the financial results for any of the outstanding PSUs to account for the impact of COVID-19.
Instead, the Compensation Committee determined it was appropriate to make a modest adjustment to the non-financial payment of each NEO to recognize each leader’s individual performance during the pandemic. In particular, the Committee recognized that in addition to pursuing the Company’s ongoing long-term strategy, eachand Performance
Lastly, to further align the 2020 annual incentive awards with AXIS’ long-term performance, the Committee decided to deliver 20% of each NEO’s annual incentive award in RSUs (in lieu of cash).
Pay and Performance—Compensation Structure
Our Compensation Committee is focused on maintaining a pay for performance orientation, while ensuring that executives are aligned with shareholders and the Company’s long-term goals.
| ||||
With that in mind, a substantial portion of our NEOs’ compensation is subject to performance. The below charts illustrate the 2020 actualtarget mix of pay for our CEO and other current NEOs for the 20202022 performance year:
| ||||||||
| 36 | COMPENSATION DISCUSSION AND ANALYSIS | |||||||

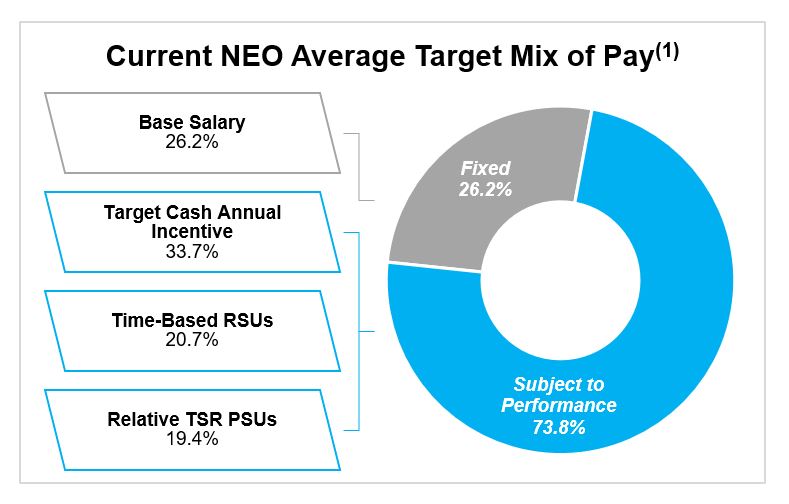
is performance-based. For our NEOs, on average, approximately 68%74% of their actual earnedtarget compensation was subject to performance.
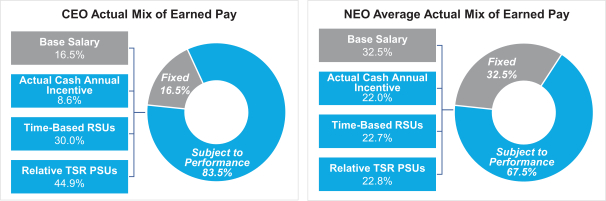
The 2020 actualis performance-based. Averages include the NEOs that currently serve in leadership roles at the Company: Messrs. Vogt, Tizzio, Phillips, and Brooks. Messrs. Arora and Wilson are excluded, since they did not receive equity grants for the 2022 performance year and their ultimate mix of earnedawarded pay for the 2022 performance year was in accordance with the separation provisions in their employment agreements.
| ||||||||
| COMPENSATION DISCUSSION AND ANALYSIS | 37 | |||||||

| 2020 Performance Year | 2021 Performance Year | 2022 Performance Year | |||||||||
| Base Salary | 1,100 | 1,100 | 1,100 | ||||||||
| Actual Bonus | 578 | 2,276 | 2,002 | ||||||||
RSUs (Time-Based) | 2,000 | 2,700 | 2,000 | ||||||||
Relative TSR PSUs (Assumes Target Performance) | 3,000 | 4,050 | 3,000 | ||||||||
| Total Performance Year Compensation | 6,678 | 10,126 | 8,102 | ||||||||
Pay Further, the graph and Performance – CEO Compensation
Our CEO demonstrated strong leadershiptable above reflect the fair market value of the equity compensation at the time of grant communicated to our NEOs for compensation purposes, as opposed to the value of the equity awards under Monte-Carlo simulation (as required by accounting rules and advanced the Company’s long-term strategic achievements during a year characterized by an extraordinary global pandemic and severe catastrophe events. Nonetheless, to reinforce our commitment to a clear link between pay and performance, the Compensation Committee approved the following with respect to CEO compensation for the 2020 performance year:
No base salary increase
Bonus was paid at 30% of target, resulting in a 18% decreasereflected in the CEO’s actual annual incentive award year-over-year
No increase in equity awards from prior year
Total direct compensation for our CEO, which we define as 2020 base salary, bonus and equity awarded for 2020 performance, was reduced from his prior performance year compensation. The Committee maintained the CEO’s actual compensation mix to ensure that approximately 75% is received in the form of equity which directly aligns his compensation with the shareholder’s experience.
| ||||||
Since 2018, there has been a significant decrease in our CEO’s total direct compensation as a result of the Company’s financial performance, as illustrated in the chart below:
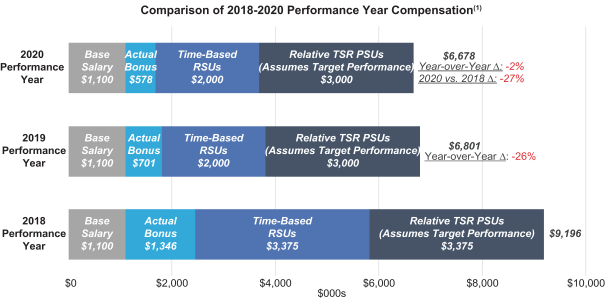
|
| ||||||||
| 38 | COMPENSATION DISCUSSION AND ANALYSIS | |||||||
| What We Do |
PSet robust goals at the beginning of the year, ensuring adequate stretch goals within our risk framework
PLink performance metrics to strategy to support shareholder value
PProvide appropriate mix of fixed and variable pay to reward Company, business unit, and individual performance
PBalance equity awards between PSUs
PRetain discretion of incentive awards by our Human Capital and Compensation Committee
PMaintain robust stock ownership guidelines
PMaintain a Clawback Policy
PRetain an independent compensation consultant
PEngage in regular shareholder outreach
| |||||
What We |
ONo hedging or pledging of AXIS stock
ONo individual executive retirement plans
ONo excise tax gross-ups upon change of control or termination
ONo single-trigger vesting of equity-based awards upon change in control | |||||
| ||||
| ||||||||
| COMPENSATION DISCUSSION AND ANALYSIS | 39 | |||||||
| Used In: | |||||||||||||||||||
| Metric | Annual Incentive Awards | Long - Term Incentive Awards | Why Metric is Important to AXIS and Our Strategy | ||||||||||||||||
OROACE | X | •This metric reflects the rate of return the Company is earning on its capital and surplus. •Our goal is to achieve •
| |||||||||||||||||
| Relative TSR | |||||||||||||||||||
| X | • •TSR explicitly links long-term incentive compensation to shareholder value. •rTSR measures shareholder value creation compared to a group of similarly-situated companies. •
•Directly correlates to other relevant key performance metrics, including | |||||||||||||||||
Company and Individual Non-Financial Metrics: At the beginning of the year, the Committee approves the Company’s non-financial objectives, which are aligned with the Company’s strategic enterprise goals. At the end of the year, our CEO evaluates and makes compensation recommendations to the Committee on the performance of the NEOs against these objectives. The Committee in turn reviews the individual performance of each NEO, considers the recommendations from our CEO (except with regard to his own individual performance) and makes a final decision for each NEO’s compensation.
| ||||||||||
| COMPENSATION DISCUSSION AND ANALYSIS | | |||||||||
| Component |
| Link to Shareholder Value | Description | |||||||||||||||
| SHORT-TERM | Base Salary | |||||||||||||||||
|
| •Attract and retain talented executives, and reflect level of global responsibility and experience | •Annual fixed-cash compensation | |||||||||||||||
| Annual Incentive | •Drive performance consistent with our annual financial goals |
| ||||||||||||||||
| ||||||||||||||||||
Non-Financial Performance | ||||||||||||||||||
| PSUs | •Promote accountability and strategic long-term decision-making | period | ||||||||||||||||
set forth in "Peer Benchmarking" | Vesting ≥ 85th 200% 55th 100% 25th 25% < 25th 0% | |||||||||||||||||
| RSUs |
|
| ||||||||||||||||
|
| |||||||||||||||||
|
| |||||||||||||||||
| ||||||||||||||||||
•Foster a culture of ownership, aligning long-term interests of our executives and shareholders | •Vests ratably over four years | |||||||||||||||||
| ||||||||
| COMPENSATION DISCUSSION AND ANALYSIS | |||||||
Name | 2019 Base Salary ($) | 2020 Base Salary ($) | 2021 Base Salary ($) | |||
Albert A. Benchimol | 1,100,000 | 1,100,000 | 1,100,000 | |||
Peter J. Vogt | 600,000 | 600,000 | 600,000 | |||
Steve K. Arora | 900,000 | 900,000 | 900,000 | |||
David S. Phillips | 600,000 | 600,000 | 600,000 | |||
Peter W. Wilson | 900,000 | 900,000 | 900,000 |
| Name | 2021 Base Salary ($) | 2022 Base Salary ($) | 2023 Base Salary ($) | ||||||||
| Albert A. Benchimol | 1,100,000 | 1,100,000 | 1,100,000 | ||||||||
| Peter J. Vogt | 675,000 | 675,000 | 675,000 | ||||||||
Vincent C. Tizzio(1) | — | 850,000 | 850,000 | ||||||||
| David S. Phillips | 625,000 | 625,000 | 625,000 | ||||||||
Conrad D. Brooks(2) | — | 500,000 | 500,000 | ||||||||
Steve K. Arora(3) | 925,435 | 932,851 | N/A | ||||||||
| Peter W. Wilson | 900,000 | 900,000 | N/A | ||||||||
(1)As Mr. Tizzio joined the Company in January 2022, we have disclosed Mr. Tizzio's base salary for only 2022 and 2023. (2)As Mr. Brooks was designated a named executive officer in 2022, we have disclosed his base salary for only 2022 and 2023. (3)Mr. Arora's employment agreement was amended and localized to Switzerland in May 2021. For the remainder of 2021 his base salary of 860,000 CHF was denominated and paid in CHF. The 2021 salary shown on this table reflects the five months of Mr. Arora's base salary that was paid in USD (375,000) and the seven months of base salary paid in CHF (550,435) converted to USD at an exchange rate of 1.09721 USD per CHF, consistent with the exchange rate in effect at the balance sheet date of December 31, 2021. For 2022, Mr. Arora's base salary reflects his annualized base salary 860,000 CHF converted to USD at an exchange rate of 1.08471 USD per CHF consistent with the exchange rate in effect at the balance sheet date of December 31, 2022. | |||||||||||
Name | 2019 Bonus Target | 2020 Bonus Target | 2021 Bonus Target | |||
Albert A. Benchimol | 175% | 175% | 175% | |||
Peter J. Vogt | 115% | 115% | 125% | |||
Steve K. Arora | 125% | 125% | 125% | |||
David S. Phillips | 125% | 125% | 125% | |||
Peter W. Wilson | 125% | 125% | 125% |
below.
| Name | 2021 Bonus Target | 2022 Bonus Target | 2023 Bonus Target | ||||||||
| Albert A. Benchimol | 175 | % | 175 | % | 175 | % | |||||
| Peter J. Vogt | 125 | % | 125 | % | 125 | % | |||||
Vincent Tizzio(1) | — | % | 150 | % | 150 | % | |||||
| David S. Phillips | 125 | % | 125 | % | 125 | % | |||||
Conrad Brooks(2) | — | % | 100 | % | 100 | % | |||||
Steve K. Arora(3) | 125 | % | 125 | % | N/A | ||||||
Peter W. Wilson(3) | 125 | % | 125 | % | N/A | ||||||
(1)As Mr. Tizzio joined the Company in January 2022, we have disclosed Mr. Tizzio's bonus target for only 2022 and 2023. (2)As Mr. Brooks was designated a named executive officer in 2022, we have disclosed his bonus target for only 2022 and 2023. (3)Each of Messrs. Arora and Wilson received their 2022 bonus at target pursuant to the severance provisions of their respective employment agreements. | |||||||||||
| ||||||||
| 42 | COMPENSATION DISCUSSION AND ANALYSIS | |||||||
| Executive | Company Financial Metric (OROACE) Weighting | Business Unit Financial Metric Weighting | Individual Non-Financial Weighting | |||
CEO | 75% | — | 25% | |||
Business Unit Leaders (1) | 35% | 35% | 30% | |||
Corporate Function Leader (2) | 60% | — | 40% |
|
|
| Financial Metrics | Strategic Business Goals (Non-Financial Metrics) | |||||||||||||
| Executive | Company Financial Metric (OROACE) Weighting | Business Unit Financial Metric Weighting | Individual Non-Financial Metrics | |||||||||||
| Albert A. Benchimol | 75 | % | — | % | 25 | % | ||||||||
| Peter J. Vogt | 70 | % | — | % | 30 | % | ||||||||
| Vincent C. Tizzio | 70 | % | — | % | 30 | % | ||||||||
| David S. Phillips | 55 | % | 30 | % | 15 | % | ||||||||
| Conrad D. Brooks | 70 | % | — | % | 30 | % | ||||||||
Steve K. Arora(1) | — | % | — | % | — | % | ||||||||
Peter W. Wilson(1) | — | % | — | % | — | % | ||||||||
(1)Each of Messrs. Arora and Wilson received their 2022 bonus at target pursuant to the severance provisions of their respective employment agreements. | ||||||||||||||
Each
For 2020, financial goals were set pre-COVID-19 andCompany's annual OROACE of 11.1% exceeded target, however this strong result was due in part to rising interest rates in 2022 which ultimately had the Committee did not adjust our financial goals to accounteffect of decreasing average shareholders' equity for the impact of the pandemicyear. The Human Capital and Compensation Committee used its discretion to determine actual bonus payouts based on Company performance.
| ||||||
For 2020, our target performance wasAdjusted OROACE, which uses beginning year shareholders' equity rather than average common shareholders' equity. An Adjusted OROACE of 10%, which was consistent with our 2019 target10.2% resulted in a bonus payout of 10% ex-PGAAP OROACE and higher than actual 2019 ex-PGAAP OROACE of 5.2%. For 2020, the Company’s annual OROACE was negative, resulting in 0% payout102% under the Company financial portion of the formula.
Historical Annual Incentive Results vs. Target (1)
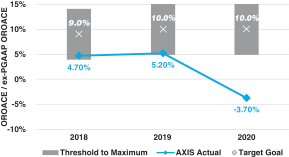
|
Annual Incentive Plan Goal Ranges (1) | ||||
|
| OROACE Achievement | Multiplier | ||
Maximum | 15% | 200% | ||
Target | 10% | 100% | ||
Threshold | 5% | 50% | ||
|
Business Unit Financial Performance Goals and Results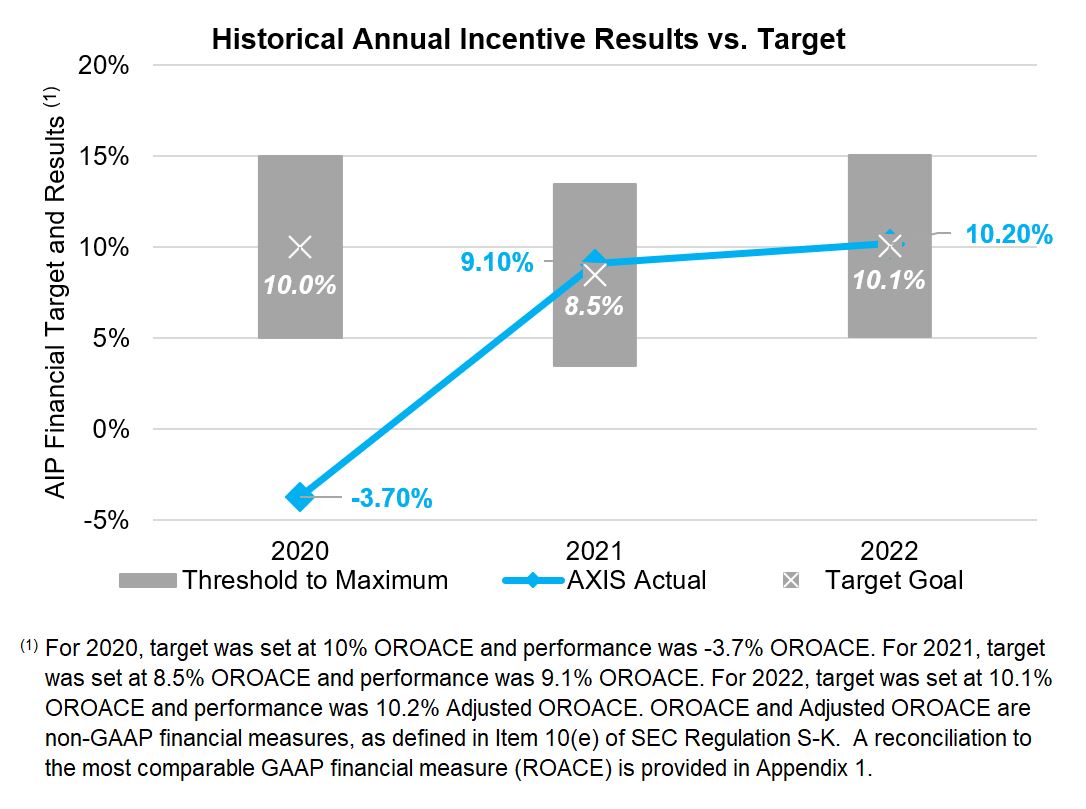 Annual Incentive Plan Goal Ranges(1)
OROACE
AchievementMultiplier Maximum 15.1 % + 200 % Target 10.1 % 100 % Threshold 5.1 % 50 % (1) The table above sets forth the threshold, target and maximum performance level, as well as the respective payout factor for the OROACE portion of the Annual Incentive Plan. For results between the applicable threshold, target or maximum levels performance level payouts are determined using linear interpolation.
Business
The business unit financial score for our Insurance and Reinsurance businesses, each of which missed their goals in 2020, was rated at 0% of target on this metric. For our Investment function,investments. In 2022, our investment portfolio performed slightly belowoutperformed the neutral benchmark, resulting in Mr. Phillips receiving a scorepayout of 67.5%120.5% of target.
| ||||||||
| COMPENSATION DISCUSSION AND ANALYSIS | |||||||
Mr. Benchimol delivered meaningful achievements
| Goal | Key Accomplishments | |||||||
| Exceed plan while delivering higher quality portfolio | •Achieved record $8.2 billion gross premiums written, and exceeded our operating plan’s projected return on risk-adjusted capital (“RoRAC”) •Portfolio construction better than planned with improved portfolio balance and reduced earnings volatility •Natural Catastrophe Probable Maximum Loss Exposure meaningfully lower than planned | |||||||
| Accelerate expansion as leading specialty insurer | •Announced new reinsurance vision, exiting property catastrophe reinsurance business and reinforcing our commitment to specialty casualty, professional lines and marine •Renewed insurance vision in June. Dedicated wholesale insurance division introduced to market with teams and resources focused specifically on the wholesale channel and positioned to introduce new products and services. •Two new centers of excellence – Small/Lower Middle and Digital – in formation in support of key strategic initiatives •Consolidated all front-end client facing businesses under one leader | |||||||
| Deliver agile and efficient organization | •Consolidated all actuarial support functions and analytics under new Chief Underwriting Officer to deliver more efficient use of data to guide underwriting actions •Identified and committed to substantial run rate savings expected to be delivered by 2025 •Insurance underwriting G&A expense ratio decreased 2 points compared to FY 2021, outperforming plan | |||||||
| Deliver measurable impact on culture, DEI and climate | •Significant DEI momentum actions. YTD received a total of 11 awards with 8 being DEI related •Jobs filled this year had 86% diverse candidate slates; 61% of all requisitions filled both internally and externally were filled with diverse candidates •Despite restructuring actions, maintained strong engagement score at 81, which is 8 points above target •Carbon reduction goals approved and published first Task Force on Climate-Related Financial Disclosures (“TCFD”) report •Maintained or improved external ESG ratings and rankings | |||||||
| Successful Leadership Transition (CEO Only) | •Managed significant leadership transitions and with positive impact overall, setting organization up for future | |||||||
| ||||||||||||
|
|
|
|
| ||||||||
|
|
|
|
| ||||||||
|
|
|
|
| ||||||||
| COMPENSATION DISCUSSION AND ANALYSIS | | |||||
Other NEOs Non-Financial Performance Achievements
Each of our NEOs and their respective functions were critical to the success of our strategy. The Committee evaluated each of the NEO’s final achievements against their non-financial goals, and a non-financial payout factor was determined for each executive. On average, the NEOs’ non-financial score was 140% which reflects the strong contributions they made to advancing our long-term strategic plan as described in the below table:
|
|
|
| |||
One-Time COVID-19 Adjustment
In addition to considering the non-financial achievements detailed above, the Compensation Committee approved an adjustment to reflect the extraordinary work of the NEOs during the COVID-19 pandemic. In particular, the Committee recognized that in addition to pursuing their annual strategic goals, each of the NEOs took on additional responsibilities and workstreams to keep our employees safe, maintain our productivity and deliver high quality service to our clients in a virtual work environment.
As a result, the Compensation Committee adjusted the annual incentive payments earned with respect to non-financial performance to reflect the specific contributions of each NEO, as shown in the table below:
| Name | COVID-19 Adjustment (%) (1) | COVID-19 Adjustment ($) | ||||||
| Albert A. Benchimol | 20 | % | 96,250 | |||||
| Peter J. Vogt | 10 | % | 41,400 | |||||
| Steve K. Arora | 15 | % | 72,141 | |||||
| David S. Phillips | 10 | % | 32,625 | |||||
| Peter W. Wilson | 15 | % | 63,281 | |||||
|
Given the COVID-19 adjustment applied by the Compensation Committee and to further align executives with the success of our long-term strategy, the Committee decided that 20% of each NEO’s 2020 annual incentive bonus was to be delivered in RSUs in lieu of cash that vest on a pro-rata basis over three years.
| ||||
Annual Incentive Performance Results and Payouts
| Albert A. Benchimol | ||||||||||||||||||||||||||||
| 2020 Metric | (A) Weighting | (B) Bonus | (C) Performance Result | (D) = A*C Factor | (E) = D*B Actual Bonus | (F) COVID-19 ($) | (G) = E + (E*F) Bonus | |||||||||||||||||||||
| Company Financial | 75% | 1,443,750 | 0% | 0.0% | 0 | 0 | 0 | |||||||||||||||||||||
| Non-Financial | 25% | 481,250 | 100% | 25.0% | 481,250 | 96,250 | 577,500 | |||||||||||||||||||||
| TARGET BONUS | 100% | 1,925,000 | TOTAL ACTUAL | 30.0% | 577,500 | |||||||||||||||||||||||
| RECEIVED IN CASH (80%) | 462,000 | |||||||||||||||||||||||||||
| RECEIVED IN EQUITY (20%)(1) | 115,500 | |||||||||||||||||||||||||||
| Peter J. Vogt | ||||||||||||||||||||||||||||
| 2020 Metric | (A) Weighting | (B) Target Bonus ($) | (C) Performance Result | (D) = A*C Payout Factor | (E) = D*B Actual | (F) COVID-19 Adjustment ($) | (G) = E + (E*F) Bonus | |||||||||||||||||||||
| Company Financial | 60% | 414,000 | 0% | 0.0% | 0 | 0 | 0 | |||||||||||||||||||||
| Non-Financial | 40% | 276,000 | 150% | 60.0% | 414,000 | 41,400 | 455,400 | |||||||||||||||||||||
| TARGET BONUS | 100% | 690,000 | TOTAL ACTUAL | 66.0% | 455,400 | |||||||||||||||||||||||
| RECEIVED IN CASH (80%) | 364,320 | |||||||||||||||||||||||||||
| RECEIVED IN EQUITY (20%)(1) | 91,080 | |||||||||||||||||||||||||||
| Steve K. Arora | ||||||||||||||||||||||||||||
| 2020 Metric | (A) Weighting | (B) Target Bonus ($) | (C) Performance Result | (D) = A*C Payout Factor | (E) = D*B Actual | (F) COVID-19 Adjustment ($) | (G) = E + (E*F) Bonus | |||||||||||||||||||||
| Company Financial | 35% | 393,750 | 0% | 0.0% | 0 | 0 | 0 | |||||||||||||||||||||
| Business Unit Financial | 35% | 393,750 | 0% | 0.0% | 0 | 0 | 0 | |||||||||||||||||||||
| Non-Financial | 30% | 337,500 | 142.5% | 42.8% | 480,938 | 72,141 | 553,078 | |||||||||||||||||||||
| TARGET BONUS | 100% | 1,125,000 | TOTAL ACTUAL | 49.2% | 553,078 | |||||||||||||||||||||||
| RECEIVED IN CASH (80%) | 442,463 | |||||||||||||||||||||||||||
| RECEIVED IN EQUITY (20%)(1) | 110,616 | |||||||||||||||||||||||||||
| David S. Phillips | ||||||||||||||||||||||||||||
| 2020 Metric | (A) Weighting | (B) Target Bonus ($) | (C) Performance Result | (D) = A*C Payout Factor | (E) = D*B Actual | (F) COVID-19 Adjustment ($) | (G) = E + (E*F) Bonus | |||||||||||||||||||||
| Company Financial | 35% | 262,500 | 0% | 0.0% | 0 | 0 | 0 | |||||||||||||||||||||
| Business Unit Financial | 35% | 262,500 | 67.5% | 23.6% | 0 | 0 | 177,188 | |||||||||||||||||||||
| Non-Financial | 30% | 225,000 | 145% | 43.5% | 326,250 | 32,625 | 358,875 | |||||||||||||||||||||
| TARGET BONUS | 100% | 750,000 | TOTAL ACTUAL | 71.5% | 536,063 | |||||||||||||||||||||||
| RECEIVED IN CASH (80%) | 428,850 | |||||||||||||||||||||||||||
| RECEIVED IN EQUITY (20%)(1) | 107,213 | |||||||||||||||||||||||||||
| Peter W. Wilson | ||||||||||||||||||||||||||||
| 2020 Metric | (A) Weighting | (B) Target Bonus ($) | (C) Performance Result | (D) = A*C Payout Factor | (E) = D*B Actual | (F) COVID-19 Adjustment ($) | (G) = E + (E*F) Bonus | |||||||||||||||||||||
| Company Financial | 35% | 393,750 | 0% | 0.0% | 0 | 0 | 0 | |||||||||||||||||||||
| Business Unit Financial | 35% | 393,750 | 0% | 0.0% | 0 | 0 | 0 | |||||||||||||||||||||
| Non-Financial | 30% | 337,500 | 125% | 37.5% | 421,875 | 63,281 | 485,156 | |||||||||||||||||||||
| TARGET BONUS | 100% | 1,125,000 | TOTAL ACTUAL | 43.1% | 485,156 | |||||||||||||||||||||||
| RECEIVED IN CASH (80%) | 388,125 | |||||||||||||||||||||||||||
| RECEIVED IN EQUITY (20%)(1) | 97,031 | |||||||||||||||||||||||||||
|
| ||||||
Albert A. Benchimol 2022 Metric (A)
Weighting(B)
Target Bonus ($)(C)
Performance Result(D) = A*C
Payout Factor(E) = D*BActual Bonus Earned ($)Company Financial 75% 1,443,750 102% 76.5% 1,472,625 Individual Non-Financial 25% 481,250 110% 27.5% 529,375 TARGET BONUS 100% 1,925,000 TOTAL ACTUAL 104.0% 2,002,000
| Peter J. Vogt | |||||||||||||||||
| 2022 Metric | (A) Weighting | (B) Target Bonus ($) | (C) Performance Result | (D) = A*C Payout Factor | (E) = D*B Actual Bonus Earned ($) | ||||||||||||
| Company Financial | 70% | 590,625 | 102% | 71.4% | 602,438 | ||||||||||||
| Individual Non-Financial | 30% | 253,125 | 120.0% | 36.0% | 303,750 | ||||||||||||
| TARGET BONUS | 100% | 843,750 | TOTAL ACTUAL | 107.4% | 906,188 | ||||||||||||
| Vincent C. Tizzio | |||||||||||||||||
| 2022 Metric | (A) Weighting | (B) Target Bonus ($) | (C) Performance Result | (D) = A*C Payout Factor | (E) = D*B Actual Bonus Earned ($) | ||||||||||||
| Company Financial | 70% | 892,500 | 102% | 71.4% | 910,350 | ||||||||||||
| Individual Non-Financial | 30% | 382,500 | 120.0% | 36.0% | 459,000 | ||||||||||||
| TARGET BONUS | 100% | 1,275,000 | TOTAL ACTUAL | 107.4% | 1,369,350 | ||||||||||||
| David S. Phillips | |||||||||||||||||
| 2022 Metric | (A) Weighting | (B) Target Bonus ($) | (C) Performance Result | (D) = A*C Payout Factor | (E) = D*B Actual Bonus Earned ($) | ||||||||||||
| Company Financial | 55% | 429,688 | 102% | 56.1% | 438,281 | ||||||||||||
| Investment Unit Financial | 30% | 234,375 | 120.5% | 36.2% | 282,422 | ||||||||||||
| Individual Non-Financial | 15% | 117,188 | 110.0% | 16.5% | 128,906 | ||||||||||||
| TARGET BONUS | 100% | 781,250 | TOTAL ACTUAL | 108.8% | 849,609 | ||||||||||||
| Conrad D. Brooks | |||||||||||||||||
| 2022 Metric | (A) Weighting | (B) Target Bonus ($) | (C) Performance Result | (D) = A*C Payout Factor | (E) = D*B Actual Bonus Earned ($) | ||||||||||||
| Company Financial | 70% | 350,000 | 102% | 71.4% | 357,000 | ||||||||||||
| Individual Non-Financial | 30% | 150,000 | 120.0% | 36.0% | 180,000 | ||||||||||||
| TARGET BONUS | 100% | 500,000 | TOTAL ACTUAL | 107.4% | 537,000 | ||||||||||||
| ||||||||
| COMPENSATION DISCUSSION AND ANALYSIS | 45 | |||||||
|
| |||||
•Vests 25% per year over four years | •Vests in a single installment on the third anniversary of the vesting commencement date •The number of PSUs that ultimately vest is based on three-year relative TSR(1) •Peer group is established at time of grant with performance measured after three years | |||||
(1)Mr. Benchimol's PSU award granted in 2023 for the 2022 performance year will be measured over 2023 only. | ||||||
2020
RSUs & PSUs Awarded in 2020 (Relating to 2019 Performance) | ||||||||||||||||
Name | RSUs (%) | RSUs ($) | PSUs (%) | PSUs ($) | Total ($) (1) | |||||||||||
Albert A. Benchimol | 40 |
| 1,999,978 |
| 60 |
| 2,999,998 |
|
| 4,999,976 |
| |||||
Peter J. Vogt | 50 |
| 424,987 |
| 50 |
| 424,987 |
|
| 849,974 |
| |||||
Steve K. Arora | 50 |
| 594,957 |
| 50 |
| 594,957 |
|
| 1,189,915 |
| |||||
David S. Phillips | 50 |
| 339,940 |
| 50 |
| 339,940 |
|
| 679,881 |
| |||||
Peter W. Wilson | 50 |
| 424,987 |
| 50 |
| 424,987 |
|
| 849,974 |
| |||||
|
With respect to PSUs, the value reflects the impact of Monte Carlo simulation required for accounting purposes, which differs from the award value granted.
| RSUs & PSUs Awarded in 2022 (Relating to 2021 Performance) | |||||||||||||||||
| Name | RSUs (%) | RSUs ($) | PSUs (%) | PSUs ($) | Total ($) (1) | ||||||||||||
| Albert A. Benchimol | 40 | % | 2,699,972 | 60 | % | 4,956,321 | 7,656,293 | ||||||||||
| Peter J. Vogt | 50 | % | 600,000 | 50 | % | 734,272 | 1,334,272 | ||||||||||
| Vincent C. Tizzio | 50 | % | 600,000 | 50 | % | 734,272 | 1,334,272 | ||||||||||
| 2,501,866 | (2) | 2,501,866 | |||||||||||||||
| David S. Phillips | 50 | % | 499,953 | 50 | % | 611,836 | 1,111,789 | ||||||||||
| Conrad D. Brooks | 60 | % | 389,980 | 40 | % | 318,169 | 708,149 | ||||||||||
| Steve K. Arora | 50 | % | 699,991 | 50 | % | 856,640 | 1,556,631 | ||||||||||
| Peter W. Wilson | 50 | % | 499,953 | 50 | % | 611,836 | 1,111,790 | ||||||||||
(1)Reflects the amounts of the NEOs' annual equity awards granted on January 25, 2022, which is based on the aggregate grant date fair value of PSUs ($68.63 per share) determined by using the Monte Carlo simulation and assuming target performance and for RSUs granted to our NEOs based on the aggregate grant date fair value equal to the closing price of our common stock on January 25, 2022 ($56.08 per share). (2)For Mr. Tizzio, the RSU award of $2,501,866 is a one-time award to replace equity forfeited at his prior employer which will vest in three equal installments on the anniversary of the vesting start date of February 1, 2022. | |||||||||||||||||
| ||||
| ||||||||
| 46 | COMPENSATION DISCUSSION AND ANALYSIS | |||||||
| 2022 Performance Scale for Determining Number of Earned PSUs | |||||||||||||
| Relative TSR Percentile | Vesting | ||||||||||||
Maximum | ≥ 85th | 200 |
|
| % | ||||||||
Target | 55th | 100 |
|
| % | ||||||||
Threshold | 25th | 25 |
|
| % | ||||||||
| < 25th | 0 | % | |||||
| PSUs Awarded in 2018 Performance Period (September 2017 – September 2020) | ||||||||
| Name | Number of Target PSUs Granted | Number of PSUs Earned Based on Performance | ||||||
Albert A. Benchimol | 51,135 | 32,215 | ||||||
Peter J. Vogt | 6,136 | 3,865 | ||||||
Steve K. Arora (1) | N/A | N/A | ||||||
David S. Phillips | 7,363 | 4,638 | ||||||
Peter W. Wilson | 9,204 | 5,798 | ||||||
|
| PSUs Awarded in 2020 Performance Period (January 2020 - December 2022) | ||||||||
| Name | Number of Target PSUs Granted | Number of PSUs Earned Based on Performance | ||||||
| Albert A. Benchimol | 48,185 | 37,198 | ||||||
| Peter J. Vogt | 6,826 | 5,269 | ||||||
| David S. Phillips | 5,460 | 4,215 | ||||||
| Conrad D. Brooks | 3,754 | 2,898 | ||||||
| Steve K. Arora | 9,556 | 7,377 | ||||||
| Peter W. Wilson | 6,826 | 5,269 | ||||||
PSUs | |||||||||||||
| Relative TSR Percentile | Vesting | ||||||||||||
Maximum | ≥ 80th | 125 |
|
| % | ||||||||
Target | 55th | 100 |
|
| % | ||||||||
Actual | 32nd | 77 |
|
| % | ||||||||
| ≤ 30th | 75 |
|
| % | ||||||||
2021
Wideningperformance for this PSU award will be measured over 2023 only, continuing to align Mr. Benchimol with the PSU payout range to a minimuminterests of 0% and a maximum of 200% of target (previous minimum was 75% and a maximum of 125%).
The Committee was also focused on ensuring that the Company’s senior leadership continues to receive a significant portion of their compensation in the form of equity, as this executive compensation strategy rewards long-term achievements that benefit the Company and our shareholders. As a result,its shareholders during this period. For additional detail surrounding the Committee awarded $5M for the CEO’s 2021treatment of Mr. Benchimol's outstanding equity award, which is below-target and equivalent toawards upon his prior year award. For the other NEOs,termination, see "Executive Compensation – Potential Payments Upon Termination or Change of Control."
| ||||||
The Committee approved the following equity awardsLTI communicated to each NEO in January 2021, which2023. These awards, with PSUs valued using the Monte Carlo simulation, will be reflected in the “SummarySummary Compensation Table”Table and “Grants"Grants of Plan-Based Awards Table”Table" in next year’s proxy statement.
2021 Equity Awards (Relating to 2020 Performance) | ||||||||||||||||
Name | RSUs (%) | RSUs ($) | PSUs (%) | PSUs ($) | Total ($) | |||||||||||
Albert A. Benchimol | 40 |
| 2,000,000 |
| 60 |
| 3,000,000 |
|
| 5,000,000 |
| |||||
Peter J. Vogt | 50 |
| 500,000 |
| 50 |
| 500,000 |
|
| 1,000,000 |
| |||||
Steve K. Arora | 50 |
| 700,000 |
| 50 |
| 700,000 |
|
| 1,400,000 |
| |||||
David S. Phillips | 50 |
| 400,000 |
| 50 |
| 400,000 |
|
| 800,000 |
| |||||
Peter W. Wilson | 50 |
| 500,000 |
| 50 |
| 500,000 |
|
| 1,000,000 |
| |||||
| ||||||||
| COMPENSATION DISCUSSION AND ANALYSIS | 47 | |||||||
| 2023 Equity Awards (Relating to 2022 Performance) | |||||||||||||||||
| Name | RSUs (%) | RSUs ($) | PSUs (%) | PSUs ($) | Total ($) | ||||||||||||
| Albert A. Benchimol | 40 | % | 2,000,000 | 60 | % | 3,000,000 | 5,000,000 | ||||||||||
| Peter J. Vogt | 50 | % | 600,000 | 50 | % | 600,000 | 1,200,000 | ||||||||||
| Vincent C. Tizzio | 50 | % | 600,000 | 50 | % | 600,000 | 1,200,000 | ||||||||||
| David S. Phillips | 50 | % | 500,000 | 50 | % | 500,000 | 1,000,000 | ||||||||||
| Conrad D. Brooks | 60 | % | 390,000 | 40 | % | 260,000 | 650,000 | ||||||||||
Steve K. Arora(1) | — | % | — | % | — | % | — | % | — | % | |||||||
Peter W. Wilson(1) | — | % | — | % | — | % | — | % | — | % | |||||||
| 2023 Performance Scale for Determining Number of Earned PSUs | ||||||||||||||
| Relative TSR Percentile | Vesting | |||||||||||||
Maximum | ≥ 85th | 200 |
|
| % | |||||||||
Target | 55th | 100 |
|
| % | |||||||||
Threshold | 25th | 25 |
|
| % | |||||||||
Minimum | < 25th | 0 |
|
| % | |||||||||
•evaluates the CEO’sCEO's performance relative to corporate goals and objectives established by the Committee and setsrecommends the CEO’sCEO's annual compensation after consulting withto the independent directors of the Board;
approves•reviews and approves annual compensation, as well as any initial offers of employment for executive committee members;
makes recommendations to the Board regarding•reviews and approves compensation programs and policies affecting our executives as well as our other employees;
makes recommendations on•reviews, approves and recommends to the Board the form and amount of director compensation;
approves•reviews and approves all equity awards to our executive committee members and establishes the pool for all other equity award recipients;
•reviews and approves the design of our incentive and equity compensation plans and any changes or amendments to those plans;
•considers the outcome of the shareholder advisory vote on executive compensation annually in connection with its determination of our NEOs’ compensation and the related programs;
•reviews and advises on executive development and succession plans.
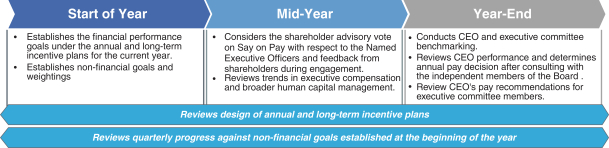
| ||||||||
| COMPENSATION DISCUSSION AND ANALYSIS | |||||||
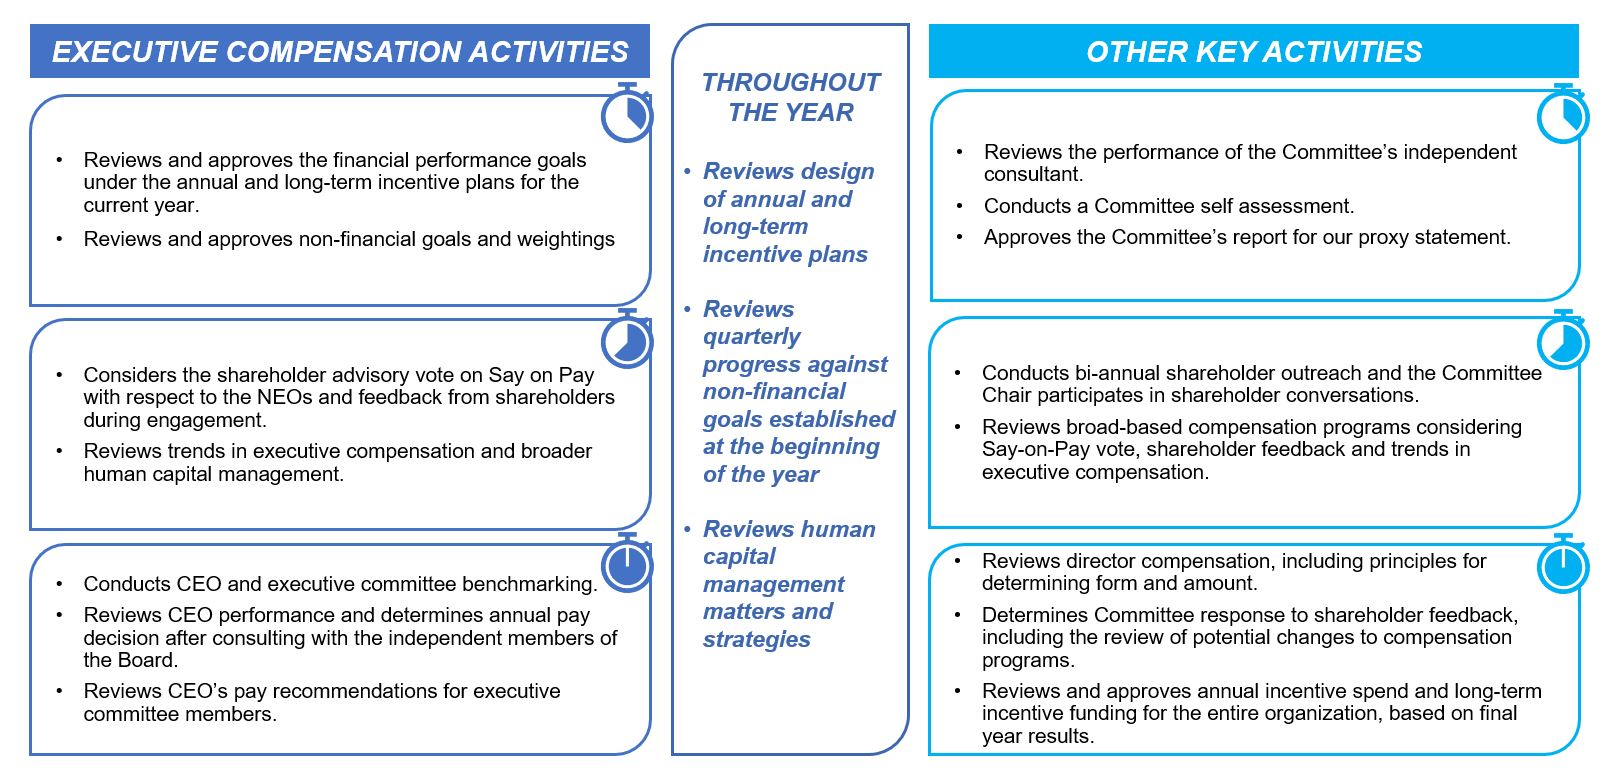
•the Committee retains downward discretion in overseeing our compensation programs, such that meaningful reductions in compensation are possible if our financial results do not meet our expectations;
•the Committee also retains downward discretion if our risk management policies or tolerances have been breached;
•our executive compensation Clawback Policy ensures that our executives are not inappropriately rewarded in the event that we are required to restate our financial results;
•our stock ownership guidelines are designed to ensure that the long-term interests of our executives are aligned with those of our shareholders;
•the ChairmanChair of our Human Capital and Compensation Committee meets annually with our Risk Committee to review the Company’s compensation policies;
•the ChairmanChair of our Risk Committee is also a member of our Human Capital and Compensation Committee; and
•our Human Capital and Compensation Committee retains an independent consultant, apart from any consultant retained by management, as discussed in detail below.
HUMAN CAPITAL AND COMPENSATION COMMITTEE CONSULTANTOur Human Capital and Compensation Committee has sole authority to select, retain and terminate any consultants or advisors used to provide independent advice to the Human Capital and Compensation Committee and evaluate executive compensation, including the sole authority to approve the fees and any other retention terms for such consultant or advisor. Korn Ferry served as the Committee’sCommittee's independent compensation consultant in 2020.2022. In December 2022, the Company retained Frederick W. Cook & Co. ("FW Cook") to serve as its independent compensation consultant for 2023. Korn Ferry was retained to provide transitional consulting services through March 31, 2023.The independent compensation consultant assisted in establishing the Company's compensation policies and programs. During 2022, the independent compensation consultant:44COMPENSATION DISCUSSION AND ANALYSIS 49
The independent compensation consultant assisted in establishing the Company’s compensation policies and programs. During 2020, the independent compensation consultant:
•reported on all aspects of short and long-term compensation program design, including incentive mix, measures and plan leverage;
•reported on emerging trends and developments in executive compensation and corporate governance;
•prepared quarterly formal presentations for the Human Capital and Compensation Committee regarding executive compensation;
prepared and •advised on peer groups;
•prepared and reviewed compensation benchmarking analysis for each of the Company’s executive committee members; and
•reviewed and advised on director compensation.
The Committee determined that FW Cook is independent and its work during 2023 will not raise any conflict of interest.
Annually, the Committeeregularly reviews the Company’s peer groups based onand considers advice from its compensation consultant. TheIn selecting its compensation peer group, is used for benchmarkingthe Committee seeks companies operating in similar industries, with a similar business model and similar size and geographic footprint. In 2023, the Committee expects to conduct a reassessment of its compensation levels and other key features of our executive compensation programs. performance peer groups.
•Alleghany Corporation(1) •Arch Capital Group Ltd. •Argo Group International Holdings, Ltd.(2) •Everest Re Group, Ltd. •Markel Corporation •Renaissance Re Holdings Ltd. •W.R. Berkley Corporation |
| |||||
| ||||
(1)Alleghany Corporation will not be included in our 2023 compensation benchmarking peer group due to recent acquisition activity.
•Mercer US Property and Casualty Insurance Survey
•Willis Towers Watson Financial Services Executive Compensation Survey
Equilar Top 25 Executive Compensation Survey
| ||||||||
| COMPENSATION DISCUSSION AND ANALYSIS | |||||||
| 2022 Performance Peer Group | |||||||||||
| Purpose •
|
•Incorporates international peers, representing the Company’s expanded global footprint •Avoids potential relative payout anomalies that could occur with a smaller sample size Selection Criteria •Global (re)insurance companies with similar geographic breadth •Relevant public P&C insurers and reinsurers •Relevant international company with similar P&C underwriting operations •Representative of the marketplace for investment capital | |||||||||
•Alleghany Corporation(1) •American Financial Group, Inc. •American International Group, Inc. •Arch Capital Group •Argo Group International Holdings, Ltd.(2) •Chubb Limited •Cincinnati Financial Corporation •CNA Financial Corporation •Everest Re Group, Ltd. •Fairfax Holdings Limited •Hannover Ruck SE •The Hanover Insurance Group, Inc. •The Hartford Financial Services Group, Inc. •James River Group Holdings Ltd. •Kinsale Capital Group | •Lancashire Holdings Limited •Markel Corporation •Munich RE •Old Republic International Corporation •ProAssurance Corporation •QBE •RenaissanceRe Holdings Ltd. •RLI Corp •SCOR SE •Selective Insurance Group •Swiss Re LTD •The Traveler’s Companies, Inc. •United Fire Group, Inc. •W.R. Berkley Corp •Zurich Re | ||||||||||
executives at peer companies.
| ||||||
employment agreements for our NEOs with a “double trigger,” which requires termination of the executive without cause or termination by the executive for good reason in connection with a change in control. Because the consummation of a transaction alone would not trigger this benefit, this structure essentially places the decision of whether or not to trigger change in control benefits largely in the hands of the acquiring company.
| ||||||||
| COMPENSATION DISCUSSION AND ANALYSIS | 51 | |||||||
RESTRICTION ON TRADING BY DIRECTORS AND OFFICERS/ANTI-HEDGING AND PLEDGING
STOCK OWNERSHIP GUIDELINES FOR DIRECTORS AND EXECUTIVE OFFICERS
The Company is monitoring stock exchange policy updates to comply with new rules adopted by SEC in October 2022 and will adjust the Clawback Policy accordingly.
Name of Position | Stock Ownership Requirements (1) | |||||||
CEO | 10x Annual Base Salary | |||||||
| 5x Total Earned Compensation | |||||||
Other NEOs | 3x Annual Base Salary | |||||||
Directors | $500,000 | |||||||
| ||||||||
(1) | Directors, NEOs and designated senior executives have five years to comply with the minimum required amount. | |||||
(2) | Total Earned Compensation as reflected in the Director Compensation table set forth later in this proxy statement. | |||||
| ||||
Tax Consequences
| ||||||||
| 52 | COMPENSATION DISCUSSION AND ANALYSIS | |||||||
| ||||||||||
| COMPENSATION DISCUSSION AND ANALYSIS | | 53 | ||||||||
COMPENSATION COMMITTEE
Henry B. Smith, Chairman
W. Marston Becker
Elanor R. Hardwick
Thomas C. Ramey
Lizabeth H. Zlatkus
| HUMAN CAPITAL AND COMPENSATION COMMITTEE | ||||||||
| Michael Millegan, Chair | |||||||
| W. Marston Becker | ||||||||
| ||||||||
| 54 | HUMAN CAPITAL AND COMPENSATION COMMITTEE REPORT | |||||||
| Name and Principal Position | Salary | Bonus | Stock Awards | Non-Equity Incentive Plan Compensation | All Other Compensation | Total | |||||||||||||||||
| Year | ($) | ($)(1) | ($)(2) | ($)(3) | ($)(4) | ($) | |||||||||||||||||
| Albert A. Benchimol CEO, President and Director | 2022 | 1,100,000 | 7,656,293 | 2,002,000 | 802,502 | 11,560,795 | |||||||||||||||||
| 2021 | 1,100,000 | 5,193,861 | 2,276,313 | 741,040 | 9,311,214 | ||||||||||||||||||
| 2020 | 1,100,000 | 77,000 | 4,999,976 | 385,000 | 703,638 | 7,265,614 | |||||||||||||||||
| Peter J. Vogt Chief Financial Officer | 2022 | 675,000 | 1,334,272 | 906,188 | 73,938 | 2,989,398 | |||||||||||||||||
| 2021 | 675,000 | 1,104,075 | 1,000,000 | 78,649 | 2,857,724 | ||||||||||||||||||
| 2020 | 600,000 | 33,120 | 849,974 | 331,200 | 67,875 | 1,882,169 | |||||||||||||||||
| Vincent C. Tizzio CEO, Specialty Insurance and Reinsurance | 2022 | 850,000 | 875,000 | 3,836,139 | 1,369,350 | 89,512 | 7,020,001 | ||||||||||||||||
| David S. Phillips Chief Investment Officer | 2022 | 625,000 | 1,111,789 | 849,609 | 62,500 | 2,648,898 | |||||||||||||||||
| 2021 | 625,000 | 917,564 | 1,000,000 | 61,250 | 2,603,814 | ||||||||||||||||||
| 2020 | 600,000 | 26,100 | 679,880 | 402,750 | 60,000 | 1,768,730 | |||||||||||||||||
| Conrad D. Brooks General Counsel | 2022 | 500,000 | 708,149 | 537,000 | 62,960 | 1,808,109 | |||||||||||||||||
Steve K. Arora (5) CEO, AXIS Reinsurance | 2022 | 932,851 | 1,556,631 | 2,538,307 | 5,027,788 | ||||||||||||||||||
| 2021 | 925,435 | 1,528,855 | 1,350,000 | 521,962 | 4,326,252 | ||||||||||||||||||
| 2020 | 900,000 | 57,713 | 1,189,914 | 384,750 | 533,181 | 3,065,558 | |||||||||||||||||
| Peter W. Wilson CEO, AXIS Insurance | 2022 | 900,000 | 1,111,790 | 3,230,068 | 5,241,858 | ||||||||||||||||||
| 2021 | 900,000 | 1,110,049 | 1,415,000 | 90,000 | 3,515,049 | ||||||||||||||||||
| 2020 | 900,000 | 50,625 | 849,974 | 337,500 | 90,000 | 2,228,099 | |||||||||||||||||
| Name and Principal Position | Year | Salary ($) | Bonus ($) (1) | Stock Awards ($) (2) | Non-Equity Incentive Plan Compensation ($) (3) | All Other Compensation ($) (4) | Total ($) | |||||||||||||||||||||
Albert A. Benchimol CEO, President and Director |
| 2020 |
|
| 1,100,000 |
| 77,000 |
|
| 4,999,976 |
| 385,000 |
| 703,638 |
| 7,265,614 | ||||||||||||
| 2019 |
|
| 1,100,000 |
| 6,749,980 |
| 700,700 |
| 894,145 |
| 9,444,825 | ||||||||||||||||
| 2018 |
|
| 1,100,000 |
| 4,624,945 |
| 1,345,575 |
| 837,966 |
| 7,908,486 | ||||||||||||||||
Peter J. Vogt Chief Financial Officer |
| 2020 |
|
| 600,000 |
| 33,120 |
|
| 849,974 |
| 331,200 |
| 67,875 |
| 1,882,169 | ||||||||||||
| 2019 |
|
| 600,000 |
| 949,920 |
| 518,880 |
| 74,210 |
| 2,143,010 | ||||||||||||||||
| 2018 |
|
| 550,000 |
| 813,236 |
| 540,100 |
| 166,375 |
| 2,069,711 | ||||||||||||||||
Steve K. Arora CEO, Axis Reinsurance |
| 2020 |
|
| 900,000 |
| 57,713 |
|
| 1,189,914 |
| 384,750 |
| 533,181 |
| 3,065,557 | ||||||||||||
| 2019 |
|
| 900,000 |
| 1,399,992 |
| 348,750 |
| 520,040 |
| 3,168,782 | ||||||||||||||||
| 2018 |
|
| 900,000 |
| 2,125,000 | (5) |
| 3,412,982 |
| - |
|
| 560,281 |
| 6,998,263 | ||||||||||||
David S. Phillips Chief Investment Officer |
| 2020 |
|
| 600,000 |
| 26,100 |
|
| 679,880 |
| 402,750 |
| 60,000 |
| 1,768,730 | ||||||||||||
| 2019 |
|
| 600,000 |
| 719,962 |
| 590,625 |
| 66,210 |
| 1,976,797 | ||||||||||||||||
| 2018 |
|
| 575,000 |
| 1,252,415 |
| 761,516 |
| 63,700 |
| 2,652,631 | ||||||||||||||||
Peter W. Wilson CEO, AXIS Insurance |
| 2020 |
|
| 900,000 |
| 50,625 |
|
| 849,974 |
| 337,500 |
| 90,000 |
| 2,228,098 | ||||||||||||
| 2019 |
|
| 900,000 |
| 999,916 |
| 543,938 |
| 90,000 |
| 2,533,854 | ||||||||||||||||
| 2018 |
|
| 900,000 |
| 1,327,412 |
| 735,000 |
| 96,656 |
| 3,059,068 | ||||||||||||||||
|
|
|
|
|
| ||||||||||
| EXECUTIVE COMPENSATION | | 55 | ||||||||
Personal ($) (1) | Housing Allowance ($) | Retirement Contributions ($) (2) | Other Compensation ($) (3) | All Other Compensation ($) | ||||||||||||||||
Albert A. Benchimol |
| 89,363 |
|
| 300,000 |
|
| 28,500 |
|
| 285,775 |
|
| 703,638 |
| |||||
Peter J. Vogt |
| 28,500 |
|
| 39,375 |
|
| 67,875 |
| |||||||||||
Steve K. Arora |
| 300,000 |
|
| 90,000 |
|
| 143,181 |
|
| 533,181 |
| ||||||||
David S. Phillips |
| 60,000 |
|
| 60,000 |
| ||||||||||||||
Peter W. Wilson |
| 90,000 |
|
| 90,000 |
| ||||||||||||||
Personal Use of Aircraft ($)(1) | Housing Allowance ($) | Retirement Contributions ($)(2) | Other Compensation ($)(3) | All Other Compensation ($) | |||||||||||||
| Name | |||||||||||||||||
| Albert A. Benchimol | 153,196 | 300,000 | 30,500 | 318,806 | 802,502 | ||||||||||||
| Peter J. Vogt | 30,500 | 43,438 | 73,938 | ||||||||||||||
| Vincent C. Tizzio | 85,000 | 4,512 | 89,512 | ||||||||||||||
| David S. Phillips | 62,500 | 62,500 | |||||||||||||||
| Conrad D. Brooks | 30,500 | 32,460 | 62,960 | ||||||||||||||
| Steve K. Arora | 135,845 | 2,402,462 | 2,538,307 | ||||||||||||||
| Peter W. Wilson | 30,500 | 3,199,568 | 3,230,068 | ||||||||||||||
|
|
|
| ||||||||
| EXECUTIVE COMPENSATION | |||||||
2022
Name | Award Type | Grant Date (1) |
Estimated Possible Payouts |
Estimated Future Payouts Awards (6) | All Other Stock or (#) (10) | Grant Date Awards ($) (11) | ||||||||||||||||||||||||||||||||
Threshold ($) (3) | Target ($) (4) | Maximum ($) (5) | Threshold # (7) | Target # (8) | Maximum # (9) | |||||||||||||||||||||||||||||||||
Albert A. Benchimol | PSU Award | 1/28/2020 |
| - |
|
| - |
|
| - |
|
| 36,138 |
|
| 48,185 |
| 60,231 |
| - |
|
| 2,999,998 | |||||||||||||||
RSU | 1/28/2020 |
| - |
|
| - |
|
| - |
|
| - |
|
| - |
|
| - |
|
| 32,123 |
| 1,999,978 | |||||||||||||||
Annual Incentive Award
| N/A |
| 86,625 |
|
| 1,925,000 |
| 3,850,000 |
| - |
|
| - |
|
| - |
|
| - |
|
| - |
| |||||||||||||||
Peter J. Vogt | PSU Award | 1/28/2020 |
| - |
|
| - |
|
| - |
|
| 5,119 |
|
| 6,826 |
| 8,532 |
| - |
|
| 424,987 | |||||||||||||||
RSU | 1/28/2020 |
| - |
|
| - |
|
| - |
|
| - |
|
| - |
|
| - |
|
| 6,826 |
| 424,987 | |||||||||||||||
Annual Incentive Award
| N/A |
| 41,400 |
|
| 690,000 |
| 1,380,000 |
| - |
|
| - |
|
| - |
|
| - |
|
| - |
| |||||||||||||||
Steve K. Arora | PSU Award | 1/28/2020 |
| - |
|
| - |
|
| - |
|
| 7,167 |
|
| 9,556 |
| 11,945 |
| - |
|
| 594,957 | |||||||||||||||
RSU | 1/28/2020 |
| - |
|
| - |
|
| - |
|
| - |
|
| - |
|
| - |
|
| 9,556 |
| 594,957 | |||||||||||||||
Annual Incentive Award
| N/A |
| 50,625 |
|
| 1,125,000 |
| 2,250,000 |
| - |
|
| - |
|
| - |
|
| - |
|
| - |
| |||||||||||||||
David S. Phillips | PSU Award | 1/28/2020 |
| - |
|
| - |
|
| - |
|
| 4,095 |
|
| 5,460 |
| 6,825 |
| - |
|
| 339,940 | |||||||||||||||
RSU | 1/28/2020 |
| - |
|
| - |
|
| - |
|
| - |
|
| - |
|
| - |
|
| 5,460 |
| 339,940 | |||||||||||||||
Annual Incentive Award
| N/A |
| 33,750 |
|
| 750,000 |
| 1,500,000 |
| - |
|
| - |
|
| - |
|
| - |
|
| - |
| |||||||||||||||
Peter W. Wilson | PSU Award | 1/28/2020 |
| - |
|
| - |
|
| - |
|
| 5,119 |
|
| 6,826 |
| 8,532 |
| - |
|
| 424,987 | |||||||||||||||
RSU | 1/28/2020 |
| - |
|
| - |
|
| - |
|
| - |
|
| - |
|
| - |
|
| 6,826 |
| 424,987 | |||||||||||||||
Annual Incentive Award
| N/A |
| 50,625 |
|
| 1,125,000 |
| 2,250,000 |
| - |
|
| - |
|
| - |
|
| - |
|
| - |
| |||||||||||||||
| Name | Award Type | Grant Date(1) | Estimated Possible Payouts Under Non-Equity Incentive Plan Awards(2) | Estimated Future Payouts Under Equity Incentive Plan Awards(6) | All Other Stock Awards: Number of Shares of Stock or Units (#)(10) | Grant Date Fair Value of Stock Awards ($)(11) | |||||||||||||||||||||||||||||
Threshold ($)(3) | Target ($)(4) | Maximum ($)(5) | Threshold #(7) | Target #(8) | Maximum #(9) | ||||||||||||||||||||||||||||||
| Albert A. Benchimol | PSU Award | 1/25/2022 | — | — | — | 18,054 | 72,218 | 144,436 | — | 4,956,321 | |||||||||||||||||||||||||
| RSU | 1/25/2022 | — | — | — | — | — | — | 48,145 | 2,699,972 | ||||||||||||||||||||||||||
| Annual Incentive Award | N/A | — | 1,925,000 | 3,850,000 | — | — | — | — | — | ||||||||||||||||||||||||||
| Peter J. Vogt | PSU Award | 1/25/2022 | — | — | — | 2,674 | 10,699 | 21,398 | — | 734,272 | |||||||||||||||||||||||||
| RSU | 1/25/2022 | — | — | — | — | — | — | 10,699 | 600,000 | ||||||||||||||||||||||||||
| Annual Incentive Award | N/A | — | 843,750 | 1,687,500 | — | — | — | — | — | ||||||||||||||||||||||||||
| Vincent C. Tizzio | PSU Award | 1/25/2022 | — | — | — | 2,674 | 10,699 | 21,398 | — | 734,272 | |||||||||||||||||||||||||
| RSU | 1/25/2022 | — | — | — | — | — | — | 10,699 | 600,000 | ||||||||||||||||||||||||||
| RSU | 1/1/2022 | — | — | — | — | — | — | 46,288 | 2,501,866 | ||||||||||||||||||||||||||
| Annual Incentive Award | N/A | — | 1,275,000 | 2,550,000 | — | — | — | — | — | ||||||||||||||||||||||||||
| David S. Phillips | PSU Award | 1/25/2022 | — | — | — | 2,228 | 8,915 | 17,830 | — | 611,836 | |||||||||||||||||||||||||
| RSU | 1/25/2022 | — | — | — | — | — | — | 8,915 | 499,953 | ||||||||||||||||||||||||||
| Annual Incentive Award | N/A | — | 781,250 | 1,562,500 | — | — | — | — | — | ||||||||||||||||||||||||||
| Conrad D. Brooks | PSU Award | 1/25/2022 | — | — | — | 1,159 | 4,636 | 9,272 | — | 318,169 | |||||||||||||||||||||||||
| RSU | 1/25/2022 | — | — | — | — | — | — | 6,954 | 389,980 | ||||||||||||||||||||||||||
| Annual Incentive Award | N/A | — | 500,000 | 1,000,000 | — | — | — | — | — | ||||||||||||||||||||||||||
| Steve K. Arora | PSU Award | 1/25/2022 | — | — | — | 3,120 | 12,482 | 24,964 | — | 856,640 | |||||||||||||||||||||||||
| RSU | 1/25/2022 | — | — | — | — | — | — | 12,482 | 699,991 | ||||||||||||||||||||||||||
| Annual Incentive Award | N/A | — | — | — | — | — | — | — | — | ||||||||||||||||||||||||||
| Peter W. Wilson | PSU Award | 1/25/2022 | — | — | — | 2,228 | 8,915 | 17,830 | — | 611,836 | |||||||||||||||||||||||||
| RSU | 1/25/2022 | — | — | — | — | — | — | 8,915 | 499,953 | ||||||||||||||||||||||||||
| Annual Incentive Award | N/A | — | — | — | — | — | — | — | — | ||||||||||||||||||||||||||
|
|
|
|
|
|
|
|
|
|
|
| ||||||||||
| EXECUTIVE COMPENSATION | | 57 | ||||||||
| Albert A. Benchimol | Mr. Benchimol serves as our President and Chief Executive | ||||
On December 15, 2022, the Company announced that it would not be renewing its employment agreement with Mr. Benchimol and thus Mr. Benchimol will no longer serve as President and Chief Executive Officer, effective as of the close of business on May 4, 2023. Mr. Benchimol will serve in a transitional role through December 31, 2023 and will depart the Company upon the completion of his term of service. Under Mr. Benchimol’s employment agreement, |
| Control – Departure of Mr. Benchimol" below. The employment agreement also provides for a 12-month notice period should Mr. Benchimol desire to voluntarily terminate his employment with the Company and non-competition and non-solicitation provisions for a period of 24 months from the date of any termination under the employment agreement. |
| Peter J. Vogt | Mr. Vogt serves as our Chief Financial Officer under the terms of an employment agreement dated December 11, 2017, as amended on October 2, 2020 and as further amended on June 17, 2021, for a term of service Additionally, Mr. Vogt’s employment agreement provides for certain benefits upon termination of his employment for various reasons, as described below under “Potential Payments Upon Termination or Change in Control.” The employment agreement also requires a 12-month notice period in the event Mr. Vogt voluntarily terminates his employment with the Company and non-competition and non-solicitation provisions which apply for a period of 12 months from the date of any termination under the employment agreement. | ||||
| ||||||||
| 58 | EXECUTIVE COMPENSATION | |||||||
| Vincent C. Tizzio | Mr. Tizzio serves as the Company's CEO Specialty Insurance and Reinsurance pursuant to an employment agreement entered into on May 21, 2021 (as amended, the “2021 Agreement”). On December 15, 2022, the Company announced that Mr. Tizzio will succeed Mr. Benchimol as President and Chief Executive Officer, effective as of the close of business on May 4, 2023. As a result, the Company and Mr. Tizzio expect to enter into a new employment agreement that will become effective as of the close of business on May 4, 2023 and will replace the 2021 Agreement in its entirety. When the Company enters into a final employment agreement with Mr. Tizzio, a copy of the agreement will be filed with the SEC as required. Under the 2021 Agreement, effective through the close of business on May 4, 2023, Mr. Tizzio is entitled to: (i) an annual base salary of no less than $850,000; (ii) participation in our annual incentive plan at an annual bonus target of 150% of base salary should performance targets be met; (iii) participation in our long-term equity compensation plan with an annual target award valued at $1,200,000; (iv) participation in any employment benefit plans generally made available to our executives; and (v) any fringe benefits we provide to our executives generally. These benefits are reflected in the “All Other Compensation” column of the Summary Compensation Table and the related footnote. The 2021 Agreement also includes a six month notice requirement in the event Mr. Tizzio voluntarily terminates his employment with the Company, a non-competition provision for a period of six months from the date of termination of his employment for any reason and a non-solicitation provision for a period of 12 months from the date of termination of his employment for any reason. The 2021 Agreement provides for certain benefits upon termination of his employment for various reasons and upon non-renewal of his employment agreement, as described below in the section titled “ Potential Payments Upon Termination or Change in Control.” | ||||
| David S. Phillips | Mr. Phillips serves as the Company’s Chief Investment Officer under an employment agreement dated March 21, 2014, as amended on June 17, 2021, for a term of service that automatically renews unless either Mr. Phillips or the Company provides six months’ prior written notice of non-renewal, or Mr. Phillips is otherwise terminated under the employment agreement. Under the employment agreement, Mr. Phillips is entitled to: (i) an annual base salary of no less than $625,000; (ii) participation in our annual incentive plan at an annual bonus target of 125% | ||||
Mr. |
The employment agreement also |
| |||||
| Conrad D. Brooks | Mr. |
| ||||
|
|
Mr. |
The employment agreement also | |||||
| ||||||||
| EXECUTIVE COMPENSATION | 59 | |||||||
| Steve K. Arora | Mr. Arora served as the Chief Executive Officer of AXIS Reinsurance through June 30, 2022 and in a transition role from July 1, 2022 through December 31, 2022. Pursuant to Mr. Arora's employment agreement, dated May 21, 2021, Mr. Arora was entitled to: (i) an annual base salary of no less than CHF 860,000; (ii) participation in our annual incentive plan at an annual bonus target of 125% of base salary should performance targets be met; (iii) participation in any employment benefit plans generally made available to our executives; and (vi) any fringe benefits we provide to our executives generally. These benefits are reflected in the “All Other Compensation” column of the Summary Compensation Table and the related footnote. Additionally, in consideration of Mr. Arora’s international posting in Zurich, Switzerland, he was entitled to the following benefits pursuant to a letter agreement dated May 21, 2021: (i) a 2021 housing and utilities’ allowance in the amount of CHF 287,000; (ii) reimbursement of up to CHF 143,000 in 2021 for his children’s’ schooling; and (iii) reimbursement for tax preparation services obtained for the 2020 and 2021 tax years. On June 7, 2022, the Company announced that Mr. Arora would depart the Company effective December 31, 2022. In connection with his termination without cause, Mr. Arora and the Company entered into a separation agreement (the "Separation Agreement") on June 6, 2022. Under the terms of the Separation Agreement and subject to Mr. Arora’s execution of a general release of claims and continued compliance with the restrictive covenants referenced in his employment agreement (6-month non-competition provision and 12-month non-solicitation provision), Mr. Arora received the payments and benefits required under his employment agreement relating to a termination by the Company without cause or by the executive for good reason, including the continued vesting of his outstanding equity awards that remained unvested as of his separation date. In addition, the Company agreed to reimburse Mr. Arora for his legal expenses. For more information on the severance benefits received by Mr. Arora, see the section titled "Potential Payments Upon Termination or Change in Control" below. | ||||
| Peter W. Wilson |
Mr. Wilson | ||||
| ||||||
compensation plan with an initial annual target award valued at $900,000 |
In January 2022, the Company provided Mr. Wilson with notice of a non-renewal of his employment agreement. Mr. Wilson served as CEO of AXIS Insurance through May 31, 2022 and in a transitional role through December 31, 2022 timed to the completion of his employment agreement. Under Mr. Wilson’s employment agreement, |
The Human Capital and |
The Compensation Committee regularly reviews and may make changes to the value of compensation components, as needed, as described in the “Compensation Discussion ofand Analysis – Elements of Executive Compensation.”
| ||||
Long-Term Equity Compensation Plans.In 2020, we provided
| ||||||||
| 60 | EXECUTIVE COMPENSATION | |||||||
59.5.
| ||||||
Mr. Arora received health benefits and other benefits consistent with our other Swiss employees, including participation in the Swiss retirement plan and a monthly health insurance allowance.
The Company permits personal use2022.
| ||||
| Stock Awards | ||||||||||||||||||||
| Name | Grant Date | Number of (#) | Market Value ($) | Equity (#) | Equity Incentive Plan ($) | |||||||||||||||
Albert A. Benchimol |
| 1/31/2017 | (1) |
| 11,229 |
| 565,829 |
|
| - |
|
| - |
| ||||||
| 2/6/2018 | (2) |
| 32,215 |
| 1,623,314 |
|
| - |
|
| - |
| |||||||
| 2/6/2018 | (1) |
| 21,732 |
| 1,095,075 |
|
| - |
|
| - |
| |||||||
| 1/29/2019 | (1) |
| 46,275 |
| 2,331,797 |
|
| 61,700 |
| 3,109,063 |
| ||||||||
| 1/28/2020 | (1) |
| 32,123 |
| 1,618,678 |
|
| 48,185 |
| 2,428,042 |
| ||||||||
| | Aggregate Market Value: | | ||||||||||||||||||
| 12,771,799 |
| ||||||||||||||||||
| Peter J. Vogt | 1/31/2017 | (1) | 782 | 39,405 | - | - | ||||||||||||||
| 5/1/2017 | (1) | 1,044 | 52,607 | - | - | |||||||||||||||
| 2/6/2018 | (2) | 3,865 | 194,757 | - | - | |||||||||||||||
| 2/6/2018 | (4) | 1,456 | 73,368 | - | - | |||||||||||||||
| 2/6/2018 | (1) | 3,068 | 154,597 | - | - | |||||||||||||||
| 1/29/2019 | (1) | 6,513 | 328,190 | 8,683 | 437,536 | |||||||||||||||
| 1/28/2020 | (1) | 6,826 | 343,962 | 6,826 | 343,962 | |||||||||||||||
| | Aggregate Market Value: | | ||||||||||||||||||
| 1,968,385 | ||||||||||||||||||||
| Steve K. Arora | 1/1/2018 | (3) | 20,296 | 1,022,715 | - | - | ||||||||||||||
| 1/1/2018 | (4) | 16,327 | 822,718 | - | - | |||||||||||||||
| 1/29/2019 | (1) | 9,598 | 483,643 | 12,797 | 644,841 | |||||||||||||||
| 1/28/2020 | (1) | 9,556 | 481,527 | 9,556 | 481,527 | |||||||||||||||
| | Aggregate Market Value: | | ||||||||||||||||||
| 3,936,971 | ||||||||||||||||||||
| David S. Phillips | 1/31/2017 | (1) | 809 | 40,766 | - | - | ||||||||||||||
| 2/6/2018 | (2) | 4,638 | 233,709 | - | - | |||||||||||||||
| 2/6/2018 | (4) | 4,000 | 201,560 | - | - | |||||||||||||||
| 2/6/2018 | (1) | 3,129 | 157,670 | - | - | |||||||||||||||
| 1/29/2019 | (1) | 4,936 | 248,725 | 6,581 | 331,617 | |||||||||||||||
| 1/28/2020 | (1) | 5,460 | 275,129 | 5,460 | 275,129 | |||||||||||||||
| | Aggregate Market Value: | | ||||||||||||||||||
| 1,764,305 | ||||||||||||||||||||
| Peter W. Wilson | 1/31/2017 | (1) | 2,021 | 101,838 | - | - | ||||||||||||||
| 2/6/2018 | (2) | 5,798 | 292,161 | - | - | |||||||||||||||
| 2/6/2018 | (4) | 3,376 | 170,117 | - | - | |||||||||||||||
| 2/6/2018 | (1) | 3,912 | 197,126 | - | - | |||||||||||||||
| 1/29/2019 | (1) | 6,855 | 345,423 | 9,140 | 460,565 | |||||||||||||||
| 1/28/2020 | (1) | 6,826 | 343,962 | 6,826 | 343,962 | |||||||||||||||
| | Aggregate Market Value: | | ||||||||||||||||||
| 2,255,154 | ||||||||||||||||||||
| ||||||||||
| EXECUTIVE COMPENSATION | | 61 | ||||||||
| Name | Stock Awards | ||||||||||||||||||||||
| Grant Date | Number of Shares or Units of Stock That Have Not Vested (#) | Market Value of Shares or Units of Stock That Have Not Vested ($) | Equity Incentive Plan Awards: # of Unearned PSU Shares, Units or Other Rights That Have Not Vested (#) | Equity Incentive Plan Awards: Market or Payout Value of PSU Unearned Shares, Units or Other Rights That Have Not Vested ($) | |||||||||||||||||||
| Albert A. Benchimol | 1/29/2019 | (1) | 15,425 | $835,572 | — | — | |||||||||||||||||
| 1/28/2020 | (2) | 37,198 | $2,015,016 | — | — | ||||||||||||||||||
| 1/28/2020 | (1) | 16,062 | $870,079 | — | — | ||||||||||||||||||
| 1/26/2021 | (1) | 31,387 | $1,700,234 | (4) | 62,774 | $3,400,468 | |||||||||||||||||
| 1/26/2021 | (3) | 1,611 | $87,268 | — | — | ||||||||||||||||||
| 1/25/2022 | (1) | 48,145 | $2,608,015 | (4) | 72,218 | $3,912,049 | |||||||||||||||||
| Aggregate Market Value: | |||||||||||||||||||||||
| $15,428,699 | |||||||||||||||||||||||
| Peter J. Vogt | 1/29/2019 | (1) | 2,171 | $117,603 | — | — | |||||||||||||||||
| 1/28/2020 | (1) | 3,413 | $184,882 | — | — | ||||||||||||||||||
| 1/28/2020 | (2) | 5,269 | $285,422 | — | — | ||||||||||||||||||
| 1/26/2021 | (1) | 7,846 | $425,018 | (4) | 10,462 | 566,727 | |||||||||||||||||
| 1/26/2021 | (3) | 1,270 | $68,796 | — | — | ||||||||||||||||||
| 1/25/2022 | (1) | 10,699 | $579,565 | (4) | 10,699 | 579,565 | |||||||||||||||||
| Aggregate Market Value: | |||||||||||||||||||||||
| $2,807,577 | |||||||||||||||||||||||
| Vincent C. Tizzio | 1/1/2022 | (3) | 46,288 | $2,507,421 | — | — | |||||||||||||||||
| 1/25/2022 | (1) | 10,699 | $579,565 | (4) | 10,699 | $579,565 | |||||||||||||||||
| Aggregate Market Value: | |||||||||||||||||||||||
| 3,666,551 | |||||||||||||||||||||||
| David S. Phillips | 1/29/2019 | (1) | 1,646 | $89,164 | — | — | |||||||||||||||||
| 1/28/2020 | (1) | 2,730 | $147,884 | — | — | ||||||||||||||||||
| 1/28/2020 | (2) | 4,215 | $228,327 | — | — | ||||||||||||||||||
| 1/26/2021 | (1) | 6,277 | $340,025 | (4) | 8,369 | 453,349 | |||||||||||||||||
| 1/26/2021 | (3) | 1,496 | $81,038 | — | — | ||||||||||||||||||
| 1/25/2022 | (1) | 8,915 | $482,926 | (4) | 8,915 | 482,926 | |||||||||||||||||
| Aggregate Market Value: | |||||||||||||||||||||||
| $2,305,638 | |||||||||||||||||||||||
| Conrad D. Brooks | 1/29/2019 | (1) | 1,257 | $68,092 | — | — | |||||||||||||||||
| 1/28/2020 | (1) | 1,877 | $101,677 | — | — | ||||||||||||||||||
| 1/28/2020 | (2) | 2,898 | $156,985 | — | — | ||||||||||||||||||
| 1/26/2021 | (1) | 5,179 | $280,546 | (4) | 4,603 | $249,345 | |||||||||||||||||
| 1/26/2021 | (3) | 665 | $36,023 | — | — | ||||||||||||||||||
| 1/25/2022 | (1) | 6,954 | $376,698 | (4) | 4,636 | $251,132 | |||||||||||||||||
| Aggregate Market Value: | |||||||||||||||||||||||
| 1,520,498 | |||||||||||||||||||||||
| Steve K. Arora | 1/29/2019 | (1) | 3,200 | $173,344 | — | — | |||||||||||||||||
| 1/28/2020 | (2) | 7,377 | $399,612 | — | — | ||||||||||||||||||
| 1/28/2020 | (1) | 4,778 | $258,824 | — | — | ||||||||||||||||||
| ||||||||
| 62 | EXECUTIVE COMPENSATION | |||||||
| Name | Stock Awards | ||||||||||||||||||||||
| Grant Date | Number of Shares or Units of Stock That Have Not Vested (#) | Market Value of Shares or Units of Stock That Have Not Vested ($) | Equity Incentive Plan Awards: # of Unearned PSU Shares, Units or Other Rights That Have Not Vested (#) | Equity Incentive Plan Awards: Market or Payout Value of PSU Unearned Shares, Units or Other Rights That Have Not Vested ($) | |||||||||||||||||||
| 1/26/2021 | (1) | 10,985 | $595,057 | (4) | 14,647 | 793,428 | |||||||||||||||||
| 1/26/2021 | (3) | 1,543 | $83,584 | — | — | ||||||||||||||||||
| 1/25/2022 | (1) | 12,482 | $676,150 | (4) | 12,482 | 676,150 | |||||||||||||||||
| Aggregate Market Value: | |||||||||||||||||||||||
| $3,656,150 | |||||||||||||||||||||||
| Peter W. Wilson | 1/29/2019 | (1) | 2,285 | $123,778 | — | — | |||||||||||||||||
| 1/28/2020 | (2) | 5,269 | $285,422 | — | — | ||||||||||||||||||
| 1/28/2020 | (1) | 3,413 | $184,882 | — | — | ||||||||||||||||||
| 1/26/2021 | (1) | 7,846 | $425,018 | (4) | 10,462 | 566,727 | |||||||||||||||||
| 1/26/2021 | (3) | 1,354 | $73,346 | — | — | ||||||||||||||||||
| 1/25/2022 | (1) | 8,915 | $482,926 | (4) | 8,915 | 482,926 | |||||||||||||||||
| Aggregate Market Value: | |||||||||||||||||||||||
| $2,625,024 | |||||||||||||||||||||||
|
|
|
|
2022
| Stock Awards | ||||||||||
| Name | Number of Shares Acquired on Vesting (#) | Market Value Realized on Vesting ($) | ||||||||
Albert A. Benchimol | 64,758 | 3,634,219 | (1) | |||||||
Peter J. Vogt | 7,679 | 408,823 | (2) | |||||||
Steve K. Arora | 19,523 | 1,228,345 | (3) | |||||||
David S. Phillips | 9,978 | 559,965 | (4) | |||||||
Peter W. Wilson | 14,539 | 815,929 | (5) | |||||||
| Stock Awards | |||||||||||
| Name | Number of Shares Acquired on Vesting (#) | Market Value Realized on Vesting ($) | |||||||||
| Albert A. Benchimol | 94,332 | 4,992,049 | |||||||||
| Peter J. Vogt | 15,522 | 821,424 | |||||||||
| Vincent C. Tizzio | — | — | |||||||||
| David S. Phillips | 12,612 | 667,427 | |||||||||
| Conrad D. Brooks | 9,421 | 498,559 | |||||||||
| Steve K. Arora | 20,130 | 1,065,280 | |||||||||
| Peter W. Wilson | 16,460 | 871,063 | |||||||||
|
64,758 RSUs on March 1, 2020 based on the closing price of our common stock on March 1, 2020 of $56.12
|
6,635 RSUs on March 1, 2020 based on the closing price of our common stock on March 1, 2020 of $56.12
1,044 RSUs on May 1, 2020 based on the closing price of our common stock on May 1, 2020 of $34.93
|
16,324 RSUs on February 3, 2020 based on the closing price of our common stock on February 3, 2020 of $64.25
3,199 RSUs on March 1, 2020 based on the closing price of our common stock on March 1, 2020 of $56.12
|
9,978 RSUs on March 1, 2020 based on the closing price of our common stock on March 1, 2020 of $56.12
|
14,539 RSUs on March 1, 2020 based on the closing price of our common stock on March 1, 2020 of $56.12
| ||||||||
| EXECUTIVE COMPENSATION | |||||||
2022
| Name | Executive Contributions in Last FY ($) (1) | Registrant Contributions in Last FY ($) (2) | Aggregate Earnings in Last FY ($) | Aggregate Withdrawals/ Distributions ($) | Aggregate Balance at Last ($) (3) | |||||||||||||||
| Albert A. Benchimol | ||||||||||||||||||||
| Peter J. Vogt | 4,123 | 196,657 | ||||||||||||||||||
| Steve K. Arora | 61,500 | 7,800 | 156,410 | |||||||||||||||||
| David S. Phillips | 23,625 | 31,500 | 9,585 | 390,695 | ||||||||||||||||
| Peter W. Wilson | 61,500 | 27,928 | 559,972 | |||||||||||||||||
|
|
|
| Name | Executive Contributions in Last FY ($)(1) | Registrant Contributions in Last FY ($)(2) | Aggregate Earnings in Last FY ($) | Aggregate Withdrawals/ Distributions ($) | Aggregate Balance at Last FYE ($)(3) | ||||||||||||
| Albert A. Benchimol | |||||||||||||||||
| Peter J. Vogt | (58,425) | 162,632 | |||||||||||||||
| Vincent C. Tizzio | 54,500 | ||||||||||||||||
| David S. Phillips | 90,000 | 32,000 | (91,138) | 513,206 | |||||||||||||
| Conrad D. Brooks | |||||||||||||||||
| Steve K. Arora | (43,854) | 211,834 | |||||||||||||||
| Peter W. Wilson | (132,779) | 664,171 | |||||||||||||||
2022.
In particular,
| ||||||
may terminate Mr. Phillips’ employment without cause upon six months’ notice. The Executives may terminate their employment upon at least 12-months’ notice to us, except for Mr. Phillips whose notice period to us is six months. In addition, the Executives’ employment may be terminated as a result of either party declining to extend the term of their employment agreement.
Under each of the Executives’ employment agreements, we may terminate the Executives’ employment for cause upon the Executives’:
|
|
|
|
|
|
|
Under each of the Executives’ employment agreements, except for Mr. Phillips, in the event the Executive is terminated for cause, the Executives are given 15 days to cure the event that is the basis for the Company’s termination for cause, except that the right to cure will not apply in the event of a termination for cause due to any of the acts described in (ii), (iii) or (v) above.
Under the employment agreements, the Executives may terminate their employment for good reason if: (i) the scope of their respective position, authority or duties is materially adversely changed; (ii) their compensation is not paid or their base salary or target bonus is reduced below the levels specified in the agreement or there is a material adverse change in their employee benefits; (iii) they are required to relocate away from their current primary place of employment; (iv) they are assigned dutiescontrol that are materially inconsistent with their position with the Company; (v) with respectapplicable to Mr. Benchimol, he is required to report to any person or entity other than the Board; (vi) they are required to report to anyone other than any mutually agreed person; (vii) with respect to Mr. Benchimol, the Company fails to offer him continuing employment on terms no less favorable than set forth in his agreement at least six months before the end of his employment term; (viii) with respect to Messrs. Benchimol and Phillips, they provide the Company written notice of their intent to terminate their employment as a result of such event within 30 days of such event occurring, the Company does not make necessary corrections within 30 days of receiving such notice and Messrs. Benchimol and/or Phillips terminate their employment no later than 10 days following the end of the 30 day period; (ix) witheach Executive. With respect to Messrs. Arora and Wilson, they provide the Company written notice ofbelow summaries describe the severance payments received in connection with their intent to terminate their employment as a result of such event within 60 days of such event occurring,respective departures from the Company does not make necessary corrections within 60 days of receiving such notice and Messrs. Arora and/or Wilson terminate their employment no later than 10 days following the end of the 60 day period; and (x) with respect to Company.
Benchimol
| ||||||||
| 64 | EXECUTIVE COMPENSATION | |||||||
| ||||
In the event that the Executives’ employment is terminated by the Company without cause or by them, in each case within 24 months following a change in control, they will be entitled to: (i) a lump sum amount equal to one year’s base salary, except for Mr. Benchimol who will be entitled to a lump sum amount equal to two year’s base salary; (ii) an amount equal to two times the annual bonus that they would have been entitled to receive for the calendar year in which their termination occurs, except for Mr. Benchimol who will be entitled to an amount equal to three times the higher of (a) the highest annual bonus earned for any of the three calendar years preceding the date of termination, or (b)(2) the annual bonus that he would have been entitled to receive for the calendar year in which his termination occurs; (iii) all outstanding and unvested RSUs and PSUs held by him shall immediately vest upon termination; (iv) a pro-rata portion of the annual bonus that theyhe would have been entitled to receive for the calendar year in which theirhis termination occurs, except for Mr. Phillips; (iv)occurs; (v) continued payment by the Company of medical coverage or COBRA premiums for a 12-month period, or less in the event that they ceasehe ceases to be eligible for COBRA continuation coverage; (v) all outstanding and unvested RSUs and PSUs held by them shall immediately vest upon termination; (vi) with respect to Mr. Benchimol, a cash lump sum amount equal to his most recent annual equity award; and (vii) with respect to Messrs. Arora, Benchimol, Vogt and Wilson, if
| ||||||||
| EXECUTIVE COMPENSATION | 65 | |||||||
Mr. Benchimol will receive the payments and benefits required under his employment agreement in connection with the Company's non-renewal of his contract. This agreement was originally entered into in 2012 with subsequent renewals and amendments. The payments described below and included in the table below reflect these contractual obligations. | ||||||||||||||
Under the employment agreements, the Executives areagreement, Mr. Vogt is required to execute a general release and waiver of claims against us and to resign from their positionshis position upon termination of theirhis employment for any reason. The Executives areMr. Vogt is subject to non-competition and non-solicitation (of our employees and customers) provisions for a period of 12 months after termination for any reason,reason. Additionally, Mr. Vogt is subject to ongoing confidentiality requirements.
| ||||||||
| 66 | EXECUTIVE COMPENSATION | |||||||
| ||||||||
| EXECUTIVE COMPENSATION | 67 | |||||||
| ||||||||
| 68 | EXECUTIVE COMPENSATION | |||||||
| ||||||||||
| EXECUTIVE COMPENSATION | | 69 | ||||||||
| ||||||||
| 70 | EXECUTIVE COMPENSATION | |||||||
| Name | Death or Disability | Executive Termination for Good Reason or Company Termination Without Cause (pre-Change in Control) | Executive Termination for Good Reason or Company Termination Without Cause in Connection with Change in Control (1) | |||||||||
Albert A. Benchimol | ||||||||||||
Base Pay ($) | 1,100,000 | 2,200,000 | 2,200,000 | |||||||||
Separation Bonus ($) | 1,925,000 | 5,775,000 | 7,700,000 | |||||||||
Value of Equity Awards ($) (2) | 12,771,799 | 12,771,799 | 12,771,799 | |||||||||
Benefits and Perquisites: Medical, Dental, Vision ($) (3) | 47,044 | 47,044 | 47,044 | |||||||||
Cash Payments (4) | - | 5,000,000 | 5,000,000 | |||||||||
Total ($) | 15,843,843 | 25,793,843 | 27,718,843 | |||||||||
Peter J. Vogt | ||||||||||||
Base Pay ($) | - | 600,000 | 600,000 | |||||||||
Separation Bonus ($) | 690,000 | 1,380,000 | 2,070,000 | |||||||||
Value of Equity Awards ($) (2) | 1,968,385 | 1,968,385 | 1,968,385 | |||||||||
Benefits and Perquisites: Medical, Dental, Vision ($) (3) | 32,694 | 32,694 | 32,694 | |||||||||
Total ($) | 2,691,079 | 3,981,079 | 4,671,079 | |||||||||
Steve K. Arora | ||||||||||||
Base Pay ($) | - | 900,000 | 900,000 | |||||||||
Separation Bonus ($) | 1,125,000 | 2,250,000 | 3,375,000 | |||||||||
Value of Equity Awards ($) (2) | 3,936,971 | 3,936,971 | 3,936,971 | |||||||||
Benefits and Perquisites: Medical, Dental, Vision ($) (3) | 31,273 | 31,273 | 31,273 | |||||||||
Total ($) | 5,093,244 | 7,118,244 | 8,243,244 | |||||||||
David S. Phillips | ||||||||||||
Base Pay ($) | - | 450,000 | 600,000 | |||||||||
Separation Bonus ($) | 750,000 | 1,312,500 | 1,500,000 | |||||||||
Value of Equity Awards ($) (2) | 1,764,305 | 1,764,305 | 1,764,305 | |||||||||
Benefits and Perquisites: Medical, Dental, Vision ($) (3) | 32,564 | 32,564 | 32,564 | |||||||||
Total ($) | 2,546,869 | 3,559,369 | 3,896,869 | |||||||||
Peter W. Wilson | ||||||||||||
Base Pay ($) | - | 900,000 | 900,000 | |||||||||
Separation Bonus ($) | 1,125,000 | 2,250,000 | 3,375,000 | |||||||||
Value of Equity Awards ($) (2) | 2,255,154 | 2,255,154 | 2,255,154 | |||||||||
Benefits and Perquisites: Medical, Dental, Vision ($) (3) | 22,438 | 22,438 | 22,438 | |||||||||
Total ($) | 3,402,592 | 5,427,592 | 6,552,592 | |||||||||
|
|
| ||||
|
|
| ||||||||||
| EXECUTIVE COMPENSATION | | 71 | ||||||||
| Name | Death or Disability | Termination by Executive for Good Reason | Termination by Company Without Cause (pre-Change in Control) | Termination by Executive for Good Reason or Termination by Company Without Cause in Connection with Change in Control(1) | ||||||||||
| Albert A. Benchimol | ||||||||||||||
| Base Pay ($) | 1,100,000 | 2,200,000 | 2,200,000 | 2,200,000 | ||||||||||
| Separation Bonus ($) | 1,925,000 | 6,477,626 | 6,477,626 | 8,753,939 | ||||||||||
Value of Equity Awards ($) (2) | 15,428,699 | $15,428,699 | 15,428,699 | 15,428,699 | ||||||||||
Benefits and Perquisites: Medical, Dental, Vision ($) (3) | 22,901 | 22,901 | 22,901 | 22,901 | ||||||||||
Cash Payments (4) | — | 5,000,000 | 5,000,000 | 5,000,000 | ||||||||||
| Total ($) | 18,476,600 | 29,129,226 | 29,129,226 | 31,405,539 | ||||||||||
| Peter J. Vogt | ||||||||||||||
| Base Pay ($) | — | 675,000 | 675,000 | 675,000 | ||||||||||
| Separation Bonus ($) | 843,750 | 1,687,500 | 1,687,500 | 2,531,250 | ||||||||||
Value of Equity Awards ($) (2) | 2,807,577 | 2,807,577 | 2,807,577 | 2,807,577 | ||||||||||
Benefits and Perquisites: Medical, Dental, Vision ($) (3) | 35,882 | 35,882 | 35,882 | 35,882 | ||||||||||
| Total ($) | 3,687,209 | 5,205,959 | 5,205,959 | 6,049,709 | ||||||||||
| Vincent C. Tizzio | ||||||||||||||
| Base Pay ($) | — | 425,000 | 425,000 | 425,000 | ||||||||||
| Separation Bonus ($) | 1,275,000 | 2,103,750 | 2,103,750 | 3,378,750 | ||||||||||
Value of Equity Awards ($) (2) | 3,666,551 | 3,666,551 | 3,666,551 | 3,666,551 | ||||||||||
Benefits and Perquisites: Medical, Dental, Vision ($) (3) | 30,533 | 30,533 | 30,533 | 30,533 | ||||||||||
| Total ($) | 4,972,084 | 6,225,834 | 6,225,834 | 7,500,834 | ||||||||||
| David S. Phillips | ||||||||||||||
| Base Pay ($) | — | 625,000 | 468,750 | 625,000 | ||||||||||
| Separation Bonus ($) | 781,250 | 781,250 | 1,367,188 | 1,562,500 | ||||||||||
Value of Equity Awards ($) (2) | 2,305,638 | 2,305,638 | 2,305,638 | 2,305,638 | ||||||||||
Benefits and Perquisites: Medical, Dental, Vision ($) (3) | 35,882 | 35,882 | 35,882 | 35,882 | ||||||||||
| Total ($) | 3,122,770 | 3,747,770 | 4,177,458 | 4,529,020 | ||||||||||
| Conrad D. Brooks | ||||||||||||||
| Base Pay ($) | — | 500,000 | 500,000 | 500,000 | ||||||||||
| Separation Bonus ($) | 500,000 | 1,000,000 | 1,000,000 | 1,500,000 | ||||||||||
Value of Equity Awards ($) (2) | 1,520,498 | 1,520,498 | 1,520,498 | 1,520,498 | ||||||||||
Benefits and Perquisites: Medical, Dental, Vision ($) (3) | 35,882 | 35,882 | 35,882 | 35,882 | ||||||||||
| Total ($) | 2,056,380 | 3,056,380 | 3,056,380 | 3,556,380 | ||||||||||
Steve K. Arora (5) | ||||||||||||||
| Base Pay ($) | — | — | 466,425 | — | ||||||||||
| Separation Bonus ($) | — | — | 1,924,005 | — | ||||||||||
Value of Equity Awards ($) (2) | — | — | 3,656,150 | — | ||||||||||
Benefits and Perquisites: Medical, Dental, Vision ($) (3) | — | — | 1,317 | — | ||||||||||
| Total ($) | — | — | 6,047,897 | — | ||||||||||
| Peter W. Wilson | ||||||||||||||
| Base Pay ($) | — | — | 900,000 | — | ||||||||||
| Separation Bonus ($) | — | — | 2,250,000 | — | ||||||||||
Value of Equity Awards ($) (2) | — | — | 2,625,024 | — | ||||||||||
Benefits and Perquisites: Medical, Dental, Vision ($) (3) | — | — | 20,660 | — | ||||||||||
| Total ($) | — | — | 5,795,684 | — | ||||||||||
| ||||||||
| 72 | EXECUTIVE COMPENSATION | |||||||
•The median of the annual total compensation of all of our employees, excluding our CEO, was $156,400.
•The annual total compensation of our CEO was $7,265,614.
To identify our “median employee” from this employee population, we obtained from our internal compensation system annualized base salary amounts for 2020 to2022 for each employee in theour global employee population. We believe this consistently applied compensation measure reasonably reflects annual compensation across our employee base. Base salary amounts for employees located outside the United States and compensatedpaid in currencies other than U.S. dollars were converted to U.S. dollars based on the foreign exchange rates as of December 31, 2020.2022. We annualized the base salary amounts for any permanent employees in the employee population who were employed by us for less than the full fiscal year. We then ranked the resulting base salaries for all of the employees in the employee population other than our CEO to determine our median employee. Once we identified our median employee, we combined all of the elements of such employee’s compensation for 20202022 in accordance with the requirements of Item 402(c)(2)(x) of Regulation S-K for relating to the Summary Compensation Table. summary compensation table. Our 2022 median employee compensation is slightly lower than 2021 due to the impact of exchange rates when converting compensation paid in currencies other than U.S. dollars to U.S. dollars.
| ||||||||
| EXECUTIVE COMPENSATION | |||||||
| Pay Versus Performance Table | ||||||||||||||||||||||||||
| Summary Compensation Table for CEO ($) | Compensation Actually Paid to CEO ($) | Average Summary Compensation Table Total for Other NEOs ($) | Average Compensation Actually Paid to Other NEOs ($) | Value of Initial Fixed $100 Investment Based On: | ||||||||||||||||||||||
| Year | Total Shareholder Return ($) | Peer Group Total Shareholder Return ($) | Net Income ($ in thousands) | OROACE | ||||||||||||||||||||||
| (a) | (b) (1) | (c) (2) | (d) (3) | (e) (2) | (f) (4) | (g) (5) | (h) (6) | (i) (7) | ||||||||||||||||||
| 2022 | 11,560,795 | 8,860,715 | 4,122,675 | 3,803,233 | 101.10 | 148.53 | 192,833 | 11.1 | % | |||||||||||||||||
| 2021 | 9,311,214 | 9,978,155 | 3,325,710 | 3,459,324 | 98.50 | 124.95 | 588,359 | 9.1 | % | |||||||||||||||||
| 2020 | 7,265,614 | 3,748,070 | 2,236,139 | 1,671,405 | 88.11 | 106.33 | (150,674) | (3.7) | % | |||||||||||||||||
| ||||||||
| 74 | EXECUTIVE COMPENSATION | |||||||
| Reconciliation of SCT Totals to CAP Table | ||||||||||||||||||||||||||
| Year | Reported summary compensation table($) | Reported value of equity awards ($) | Equity award adjustments ($) | Reported change in the actuarial present value of pension benefits ($) | Pension benefit adjustments ($) | Compensation Actually Paid ($) | ||||||||||||||||||||
| (a) | (b) (1) | (c) (2) | (d) (3) | (e) | (f) | (g) (4) | ||||||||||||||||||||
| CEO | 2022 | 11,560,795 | (7,656,293) | 4,956,213 | — | — | 8,860,715 | |||||||||||||||||||
| 2021 | 9,311,214 | (5,193,861) | 5,860,802 | — | — | 9,978,155 | ||||||||||||||||||||
| 2020 | 7,265,614 | (4,999,976) | 1,482,432 | — | — | 3,748,070 | ||||||||||||||||||||
| Average Other NEOs | 2022 | 4,122,675 | (1,609,795) | 1,290,353 | — | — | 3,803,233 | |||||||||||||||||||
| 2021 | 3,325,710 | (1,165,136) | 1,298,750 | — | — | 3,459,324 | ||||||||||||||||||||
| 2020 | 2,236,139 | (892,436) | 327,702 | — | — | 1,671,405 | ||||||||||||||||||||
Equity Award Adjustments Table (1) | ||||||||||||||||||||||||||
| Year | Year end fair value of equity awards granted during the year ($) | Year over Year change in fair value of outstanding and unvested equity awards ($) | Fair Value as of vesting date of equity awards granted and vested in the year ($) | Year over year change in fair value of equity awards granted in prior years that vested in the year ($) | Fair value at the end of the prior year of equity awards that failed to meet vesting conditions in the year ($) | Value of dividends or other earnings paid on stock or option awards not otherwise reflected in fair value or total compensation ($) | Total equity award adjustments ($) | |||||||||||||||||||
| (a) | (b) | (c) | (d) | (e) | (f) | (g) (2) | (i) | |||||||||||||||||||
| CEO | 2022 | 6,416,394 | (1,843,609) | — | (65,555) | — | 448,983 | 4,956,213 | ||||||||||||||||||
| 2021 | 5,567,128 | (69,595) | — | (32,661) | — | 395,930 | 5,860,802 | |||||||||||||||||||
| 2020 | 4,046,720 | (2,691,619) | — | (214,998) | — | 342,329 | 1,482,432 | |||||||||||||||||||
| Average Other NEOs | 2022 | 1,442,771 | (228,474) | — | (9,954) | — | 86,010 | 1,290,353 | ||||||||||||||||||
| 2021 | 1,266,273 | (5,292) | — | (40,957) | — | 78,727 | 1,298,750 | |||||||||||||||||||
| 2020 | 722,290 | (446,689) | — | (25,195) | — | 77,295 | 327,702 | |||||||||||||||||||
| ||||||||
| EXECUTIVE COMPENSATION | 75 | |||||||
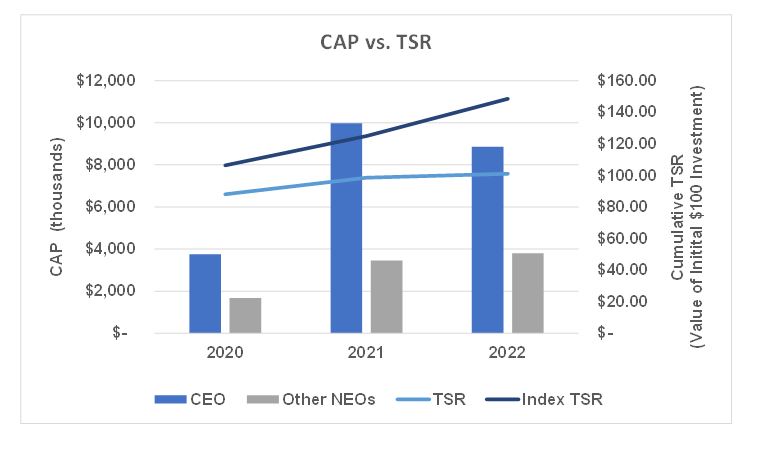
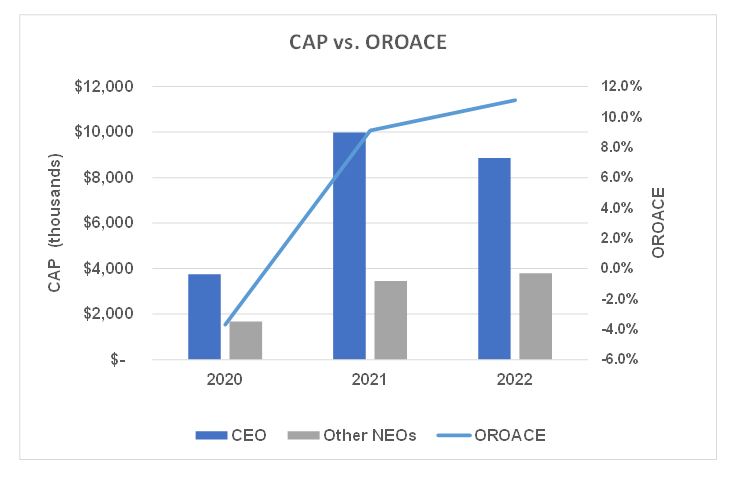
| ||||||||
| 76 | EXECUTIVE COMPENSATION | |||||||
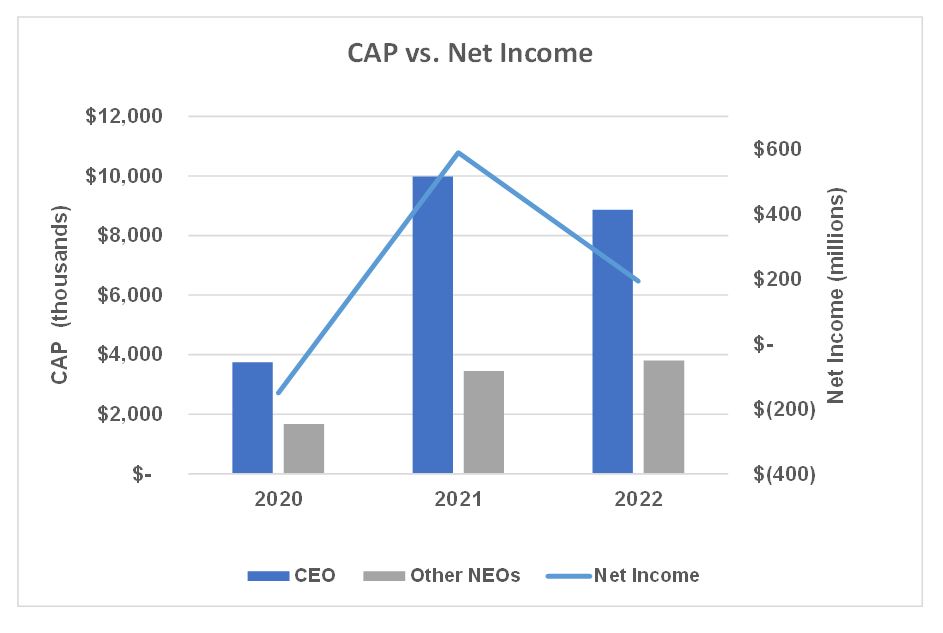
| ||||||||
| EXECUTIVE COMPENSATION | 77 | |||||||
| Name | Fees Earned or Paid in Cash ($) (1) | Stock Awards ($) (2) | All Other Compensation ($) | Total ($) | ||||||||||||
W. Marston Becker (3) | 128,634 | - | - | 128,634 | ||||||||||||
Michael A. Butt (4) | 177,398 | 99,979 | 425,973 | (5) | 703,350 | |||||||||||
Charles A. Davis | - | 229,920 | - | 229,920 | ||||||||||||
Anne Melissa Dowling | 116,250 | 116,168 | - | 232,418 | ||||||||||||
Robert L. Friedman | - | 219,953 | - | 219,953 | ||||||||||||
Christopher V. Greetham | 165,000 | 99,979 | - | 264,979 | ||||||||||||
Elanor R. Hardwick (6) | 221,921 | 99,979 | - | 321,900 | ||||||||||||
Maurice A. Keane (6) | 58,596 | 239,949 | - | 298,545 | ||||||||||||
Michael Millegan (7) | - | - | - | - | ||||||||||||
Thomas C. Ramey | 162,500 | 99,979 | - | 262,479 | ||||||||||||
Henry B. Smith (6) | 202,449 | 152,414 | 26,556 | (8) | 381,419 | |||||||||||
Axel Theis (7) | - | - | - | - | ||||||||||||
Barbara A. Yastine | 137,398 | 99,979 | - | 237,377 | ||||||||||||
Wilhelm Zeller | 229,920 | - | 229,920 | |||||||||||||
Lizabeth H. Zlatkus | 35,000 | 199,957 | - | 234,957 | ||||||||||||
|
|
|
|
|
|
|
|
| ||||||
Name Fees Earned or Paidin Cash($) (1)Stock Awards($) (2)All Other
Compensation ($)Total ($) W. Marston Becker 155,000 99,978 - 254,978 Charles A. Davis - 229,938 - 229,938 Anne Melissa Dowling 142,500 99,978 - 242,478 Elanor Hardwick(3)199,579 199,956 - 399,535 Michael Millegan 100,000 124,944 - 224,944 Thomas C. Ramey 132,500 99,978 - 232,478 Henry B. Smith (3)265,016 199,956 - 464,972 Axel Theis 100,000 124,944 - 224,944 Barbara A. Yastine 140,000 99,978 - 239,978 Lizabeth H. Zlatkus - 264,936 - 264,936
For Board service during 2020, our
| ||||||||
| 78 | 2022 DIRECTOR COMPENSATION | |||||||
| Committee Member | Annual Retainer ($) | |||||||
| Audit Committee | 15,000 | |||||||
| 10,000 | |||||||
| Corporate Governance, Nominating and Social Responsibility Committee | 7,500 | |||||||
| 10,000 | |||||||
| ||||||||
| ||||||||
Risk Committee | 10,000 | |||||||
| Committee Chair | Annual Retainer ($) | |||||||
| Audit Committee | 30,000 | |||||||
| 15,000 | |||||||
| Corporate Governance, Nominating and Social Responsibility Committee | 7,500 | |||||||
| 10,000 | |||||||
| ||||||||
| ||||||||
Risk Committee | 20,000 | |||||||
Mr. Butt, our former non-employee Chairman, received a pro-rated portion of the $150,000 retainer for service as Chairman. As noted above, Mr. Butt was also party to a Consulting Agreement which terminated December 31, 2020.
Director Compensation for 2021.
| ||||||
| Plan Category | Number of Securities to be Issued Upon Exercise of Outstanding Options, Warrants and Rights (1) | Weighted- Average Exercise Price Outstanding Options, Warrants and Rights (2) | Number of Securities Remaining Available for Future Issuance under Equity Compensation Plans (Excluding Securities Reflected in the First Column) (3) | |||||||||
Equity compensation plans approved by security holders | 1,789,816 | - | 1,912,055 | |||||||||
Equity compensation plans not approved by security holders | - | - | - | |||||||||
Total | 1,789,816 | - | 1,912,055 | |||||||||
| Plan Category | Number of Securities to be Issued Upon Exercise of Outstanding Options, Warrants and Rights (1) | Weighted- Average Exercise Price Outstanding Options, Warrants and Rights (2) | Number of Securities Remaining Available for Future Issuance under Equity Compensation Plans (Excluding Securities Reflected in the First Column) (3) | |||||||||||
| Equity compensation plans approved by security holders | 2,442,396 | - | 1,908,750 | |||||||||||
| Equity compensation plans not approved by security holders | - | - | - | |||||||||||
| Total | 2,442,396 | - | 1,908,750 | |||||||||||
|
|
|
| ||||||||||
| EQUITY COMPENSATION PLAN INFORMATION | | 79 | ||||||||
"
•Administered by the independent Human Capital and Compensation Committee, or if no such committee exists, by our Board of Directors
•Shareholder approval required for increasing the maximum number of shares available for award grants
•No reload or “evergreen” share replenishment features
•Ten year maximum term for stock options and stock appreciation rights
•No re-pricing of stock options or stock appreciation rights without prior shareholder approval
•Stock options and stock appreciation rights may not be granted below fair market value on the date of grant, except as otherwise provided by the Human Capital and Compensation Committee in the case of substitute awards
•Limited transferability – awards generally may not be transferred, except by will or the laws of descent and distribution, unless approved by the Human Capital and Compensation Committee
•Plan includes limits of total compensation for directors and the Chairman
•All awards are subject to any clawback policy adopted by the Human Capital and Compensation Committee from time to time
•Double-trigger change in control provisions in all award agreementsKey Components of Our Current Plan Administration Practices•Participation is expected to be broad-basedPROPOSAL 3. AMENDMENT TO 2017 LONG-TERM EQUITY COMPENSATION PLAN69
•No automatic grants to be made to any plan participant
•No tax gross-ups
Additional Award InformationWe understand the importance of preserving value for shareholders. Accordingly, when determining our annual equity awards, we have historically carefully monitored and considered the impact of those awards on shareholder dilution and our burn rate.PROPOSAL 4: AMENDMENT TO AMENDED AND RESTATED 2017 LONG-TERM EQUITY COMPENSATION PLAN 80 Dilution:Dilution is a measure of assessing the amount of shareholder equity that may be transferred from a company to its award recipients under an equity plan. As of March 12, 2021,10, 2023, we had an overall dilution level of 4.0%4.3% under the 2017Existing LTEP. Our share authorization request of 1,600,0001,125,000 additional shares will result in an overall dilution level of 5.7%5.5%.We calculate dilution as follows:Dilution InputsAmount ADilution Inputs Amount A Granted but unexercised stock options* 0 B Granted but unvested restricted stock and restricted stock units* 2,719,7332,477,046C Phantom share units* 0 D Shares available for issuance under all plans* 830,7431,364,600E Additional shares requested 1,600,0001,125,000F Total common shares outstanding* 84,753,53285,182,723Full Dilution = (A + B + C + D + E) ÷ (A + B + C + D + E + F) 5.7%5.5%*All amounts are as of March 12, 2021*All amounts are as of March 10, 2023Over the past three years, our full annual dilution was 5.1%4.2%, 4.7% 5.4% and 4.2% (for4.9% (for the years ended December 31, 2018, 20192020, 2021 and 2020,2022, respectively). The 2017Existing LTEP currently has 830,7431,364,600 shares available for issuance, and the 2017 LTEP provides for a share reserve of 3,400,000 shares.issuance. The share authorization request of 1,125,000 shares under the 2017Amended LTEP amendment is a conservative amount designed to manage our equity compensation needs for the next one to two years, and we anticipate our equity compensation program will continue to have a limited impact on shareholder dilution.Burn Rate:Burn rate is a measure of assessing a company’s historical use of equity compensation. We calculate burn rate by dividing the number of award sharesRSUs granted eachand PSUs vested in a given year by the weighted average common shares outstanding for the year. As shown in the table below, the Company’s three-year average annual burn rate under the 2017Existing LTEP is 0.93%1.31%. Note that we annually repurchase shares from employees to satisfy withholding tax liabilities that arise on the vesting of share-settled restricted stock units and those repurchases have decreased the Company’s outstanding shares by 570,000663,000 over the past three years.70PROPOSAL 3. AMENDMENT TO 2017 LONG-TERM EQUITY COMPENSATION PLAN
| Year | RSUs Granted | PSUs Vested | Total Granted/ Vested | Basic- Average Common Outstanding | Burn Rate = Total Granted CSO | |||||
| 2020 | 894,000 | 27,000 | 921,000 | 84,262,000 | 1.09% | |||||
| 2019 | 523,000 | 61,000 | 584,000 | 83,894,000 | 0.70% | |||||
| 2018 | 737,000 | 87,000 | 824,000 | 83,501,000 | 0.99% | |||||
| Three Year Average | 718,000 | 58,333 | 776,333 | 83,885,667 | 0.93% | |||||
| Year | RSUs Granted | PSUs Vested | Total Granted/ Vested | Basic- Weighted Average Common Shares Outstanding (CSO) | Burn Rate = Total Granted ÷ CSO | ||||||||||||
| 2022 | 993,000 | 100,000 | 1,093,000 | 84,864,000 | 1.29% | ||||||||||||
| 2021 | 1,250,000 | 66,000 | 1,316,000 | 84,707,000 | 1.55% | ||||||||||||
| 2020 | 894,000 | 27,000 | 921,000 | 84,262,000 | 1.09% | ||||||||||||
| Three Year Average | 1,045,667 | 64,333 | 1,110,000 | 84,611,000 | 1.31% | ||||||||||||
•Under the 2017Existing LTEP, on March 12, 2021,10, 2023, we granted awards to 557450 employees relating to our 20202022 performance. This represents approximately 29%22% of the employee population eligible for year-end compensation rewards.
Description of the 2017Amended LTEPThe following summarizes the material terms of the 2017Amended LTEP and is qualified in its entirety by the specific terms of the 2017Amended LTEP. A copy of the amended 2017Amended LTEP is included as Appendix 2 to this proxy statement.Purpose. The 2017Amended LTEP is intended to promote the best interests of the Company and our shareholders by attracting and retaining exceptional directors, officers, employees and consultants (including prospective directors, officers, employees and consultants). The 2017Amended LTEP is also intended to enable such individuals to participate in our long-term growth and financial success.PROPOSAL 4: AMENDMENT TO AMENDED AND RESTATED 2017 LONG-TERM EQUITY COMPENSATION PLAN 81 Types of Awards. The 2017Amended LTEP provides for a variety of types of equity and cash-based awards to provide flexibility in the compensation program. Employees and other eligible persons may receive awards of restricted stock units, performance units, restricted shares, incentive stock options, nonqualified stock options, stock appreciation rights, and other equity-based awards as determined by the Compensation Committee.Eligible Persons. Any of our or our affiliates’ directors, officers, employees or consultants (including any prospective director, officer, employee or consultant) are eligible to participate in the 2017Amended LTEP. As of March 12, 2021,10, 2023, the record date for our annual general meeting, approximately 250230 participants have equity award targets and would be eligible to receive annual awards under the 2017Amended LTEP. In addition, we expect to continue to grant equity awards to senior leaders and high performers.Plan Administration.The 2017Amended LTEP is administered by the Human Capital and Compensation Committee of our Board of Directors. The Human Capital and Compensation Committee has the power and complete discretion to select participants of awards, to determine the nature, terms, and conditions of each award, and to make any other determination and take other action that it deems necessary or desirable for the administration of the 2017Amended LTEP, including amending an outstanding award.Shares Available For Awards.The total number of our common shares that may be delivered pursuant to awards granted under the amended 2017Amended LTEP is 5,000,000,6,125,000, of which the maximum number of shares that may be delivered pursuant to incentive stock options granted under the amended 2017Amended LTEP is 5,000,0006,125,000 (inclusive of awards previously granted and shares previously reserved for issuance under the 2017Existing LTEP). If an award granted under the 2017Amended LTEP is forfeited, or otherwise expires, terminates or is cancelled or, in the case of “full value” awards (i.e., awards other than stock options or SARs), is settled in cash or net-withheld to cover taxes (up to, but not exceeding, the applicable minimum tax withholding obligation), in each case, without the delivery of shares, then the shares covered by that award will again be available for new awards under the 2017Amended LTEP. If our common shares are surrendered or tendered to us in payment of the exercise price of a stock option or any taxes required to be withheld in respect of a stock option or SAR, such shares will not become available for new awards under the 2017Amended LTEP.PROPOSAL 3. AMENDMENT TO 2017 LONG-TERM EQUITY COMPENSATION PLAN71
| PROPOSAL 4: AMENDMENT TO AMENDED AND RESTATED 2017 LONG-TERM EQUITY COMPENSATION PLAN | | |||||||
| 82 | ||||||||
| ||||||
of the fair market value of the common shares subject to the SAR at the exercise date, over the exercise price. The participant may receive cash, our common shares, other awards, other property or a combination of any of these methods of settlement, as determined by the Human Capital and Compensation Committee. The Human Capital and Compensation Committee will determine the vesting criteria, term, methods of exercise, methods and form of settlement, and any other terms and conditions of any SAR, except that no SAR may be exercisable after the tenth anniversary of the date the SAR is granted.
•the substitution or assumption of awards;
•to the extent that the surviving entity in a change of control does not substitute or assume awards, full acceleration of vesting, exercisability or lapse of restrictions on any awards, with deemed performance achievement for performance-based vesting awards determined by the Human Capital and Compensation Committee; and
•cancellation of any outstanding awards and payment to the holders of awards that are vested as of the cancellation.
•an acquisition by any individual, entity or group of beneficial ownership of 50% or more of the combined voting power of our then outstanding voting securities entitled to vote generally in the election of directors;
•a change in the composition of a majority of our Board of Directors that is not supported by a majority of the incumbent Board of Directors;
•the consummation of a reorganization, merger, share exchange, amalgamation, recapitalization, consolidation or similar transaction; or
•a complete liquidation or dissolution or the sale or disposition of all or substantially all of our assets.
Clawback of Awards. All equity and cash-based awards granted under the 2017Amended LTEP to any participant, including any executive officers of the Company, will be subject to any clawback or forfeiture policy adopted by the Human Capital and Compensation Committee or the Board of Directors. Under the terms of the Company’s Clawback Policy, as currently in effect, if the Company is required to restate its financial results because of its material noncompliance with any financial reporting requirement under the securities laws, the Committee will review all awards or payments of any form of incentive-based compensation made to current and former executive officers within thePROPOSAL 3. AMENDMENT TO 2017 LONG-TERM EQUITY COMPENSATION PLAN73
three-year period immediately preceding the date on which the Company is required to prepare the restatement and will, to the extent permitted by applicable law, seek to recover for the benefit of the Company the difference between
| PROPOSAL 4: AMENDMENT TO AMENDED AND RESTATED 2017 LONG-TERM EQUITY COMPENSATION PLAN | |||||||
| 83 | ||||||||
Consequences
| ||||||
| PROPOSAL 4: AMENDMENT TO AMENDED AND RESTATED 2017 LONG-TERM EQUITY COMPENSATION PLAN | | |||||||
| 84 | ||||||||
| ||||
| |||||||||
| PROPOSAL | |||||||||
| 85 | ||||||||
•has reviewed our audited financial statements for the year ended December 31, 20202022 and had discussions with management regarding the audited financial statements;
•has discussed with the independent registered public accounting firm the matters required to be discussed by the applicable requirements of the Public Company Accounting Oversight Board and the SEC;
•has received the written disclosures and the letter from the independent registered public accounting firm required by applicable requirements of the Public Company Accounting Oversight Board regarding the independent registered public accounting firm’s communications with the Audit Committee concerning independence; and
•has discussed with the independent registered public accounting firm their independence, the audited financial statements and other matters the Audit Committee deemed relevant and appropriate.
AUDIT COMMITTEE
Lizabeth H. Zlatkus, Chair
W. Marston Becker
Anne Melissa Dowling
Thomas C. Ramey
Barbara A. Yastine
| AUDIT COMMITTEE | ||||||||
| Lizabeth H. Zlatkus, Chair | ||||||||
W. Marston Becker(1) | ||||||||
Anne Melissa Dowling(1) | ||||||||
Michael Millegan(1) | ||||||||
| Thomas C. Ramey | ||||||||
| Axel Theis | ||||||||
| Barbara A. Yastine | ||||||||
(1)Each of Messrs. Becker and Millegan and Ms. Dowling was a member of the Audit Committee during fiscal year 2022, the period covered by this Audit Committee Report, but no longer serves as such. | ||||||||
| ||||||||
| 86 | AUDIT COMMITTEE REPORT | |||||||
| ||||||
| ||||||||||
| PROPOSAL | | 87 | ||||||||
|
| Fiscal Year 2020 ($) | Fiscal Year 2019 ($) | ||||||
Audit Fees (1) | 5,812,318 | 6,064,804 | ||||||
Audit-Related Fees (2) | 206,720 | 149,220 | ||||||
Tax Fees (3) | 45,358 | 81,910 | ||||||
Total | 6,064,396 | 6,295,934 | ||||||
|
|
|
| Fiscal Year 2022 ($) | Fiscal Year 2021 ($) | |||||||
Audit Fees (1) | 5,872,892 | 5,888,287 | ||||||
Audit-Related Fees (2) | 120,500 | 195,020 | ||||||
Tax Fees (3) | 60,470 | 46,000 | ||||||
| Total | 6,053,862 | 6,129,307 | ||||||
| ||||||||
| PRINCIPAL ACCOUNTANT FEES AND SERVICES | |||||||
| ||||||||
| 89 | ||||||
We know of no specific matter to be brought before the meeting that is not referred to in this proxy statement. If any other matter properly comes before the meeting, including any shareholder proposal properly made, the proxy holders will vote the proxies in accordance with their best judgment on such matter.
The proxies are solicited by our Board on our behalf for use at the 2021 Annual General Meeting and any adjournments or postponements thereof and we will bear the cost of the solicitation of proxies. We have engaged Morrow Sodali LLC, 470 West Ave., Stamford, CT 06902, to assist us in the solicitation of proxies and the anticipated cost of such engagement is approximately $6,500. Proxies also may be solicited by our directors, officers and employees and our subsidiaries without receiving additional compensation. The solicitation may be conducted by mail, telephone, telecopy, facsimile, email, Internet and personal solicitation. Upon request, we also will reimburse brokers, banks and others who hold shares in their names, or in the names of nominees, for forwarding proxy materials to the beneficial owners.
WE WILL FURNISH, WITHOUT CHARGE TO ANY SHAREHOLDER, A COPY OF OUR ANNUAL REPORT ON FORM 10-K THAT WE FILE WITH THE SECURITIES AND EXCHANGE COMMISSION. A COPY OF THE REPORT FOR THE FISCAL YEAR ENDED DECEMBER 31, 2020 MAY BE OBTAINED UPON WRITTEN REQUEST TO OUR SECRETARY AT AXIS HOUSE, 92 PITTS BAY ROAD, PEMBROKE HM 08, BERMUDA.
| VOTING AND MEETING INFORMATION | |||||||
| |||||||
AXIS CAPITAL HOLDINGS LIMITED
NON-GAAP FINANCIAL MEASURES RECONCILIATION (UNAUDITED)
FOR THE YEARS ENDED DECEMBER 31, 2020, 2019 AND 2018
Years ended | |||||||||||||||
2020 | 2019 | 2018 | |||||||||||||
(in thousands) | |||||||||||||||
Net income (loss) available (attributable) to common shareholders | $ | (150,674 | ) | $ | 282,361 | $ | 396 | ||||||||
Net investment (gains) losses[a] |
| (129,133 | ) |
| (91,233 | ) |
| 150,218 | |||||||
Foreign exchange losses (gains)[b] |
| 81,069 |
| (12,041 | ) |
| (29,165 | ) | |||||||
Reorganization expenses[c] |
| 7,881 |
| 37,384 |
| 66,940 | |||||||||
Interest in (income) loss of equity method investments[d] |
| 3,612 |
| (9,718 | ) |
| (993 | ) | |||||||
Income tax expense (benefit) |
| 13,023 |
| 6,656 |
| (26,697 | ) | ||||||||
|
|
|
|
|
| ||||||||||
Operating income (loss)[e] | $ | (174,222 | ) | $ | 213,409 | $ | 160,699 | ||||||||
|
|
|
|
|
| ||||||||||
Amortization of value of business acquired (“VOBA”) and intangible assets[f] |
| - |
| 37,939 |
| 184,531 | |||||||||
Amortization of acquisition cost[g] |
| - |
| (12,207 | ) |
| (125,467 | ) | |||||||
Income tax (benefit) |
| - |
| (4,888 | ) |
| (11,222 | ) | |||||||
|
|
|
|
|
| ||||||||||
Ex-PGAAP operating income (loss)[h] | $ | (174,222 | ) | $ | 234,253 | $ | 208,541 | ||||||||
|
|
|
|
|
| ||||||||||
Average common shareholders’ equity | $ | 4,757,351 | $ | 4,512,040 | $ | 4,410,668 | |||||||||
Return on average common equity |
| (3.2 | %) |
| 6.3 | % |
| - | % | ||||||
Operating return on average common equity[e] |
| (3.7 | %) |
| 4.7 | % |
| 3.6 | % | ||||||
Ex-PGAAP operating return on average common equity[h] |
| - |
| 5.2 | % |
| 4.7 | % | |||||||
|
|
|
|
|
|
|
|
| Annual Meeting Date and Time | Thursday, May 4, 2023 - 8:30 a.m. ADT | ||||||
| |||||||
| Location | AXIS House 92 Pitts Bay Road Pembroke HM 08 Bermuda | ||||||
| Other Business | We know of no specific matter to be brought before the meeting that is not referred to in this proxy statement. If any other matter properly comes before the meeting, including any shareholder proposal properly made, the proxy holders will vote the proxies in accordance with their best judgment on such matter. | ||||||
| Form 10-K and Other Matters | A copy of our annual report on Form 10-K for the fiscal year ended December 31, 2022, as filed with the SEC, will be sent to any shareholder, without charge, by regular mail upon written request addressed to our Secretary at AXIS House, 92 Pitts Bay Road, Pembroke HM 08, Bermuda. You also may obtain our Annual Report on Form 10-K over the Internet at the SEC’s website, www.sec.gov, or in the investor relations section of our website. To the extent that this proxy statement is incorporated by reference into any of our other filings under the Securities Act or the Exchange Act, the sections of this proxy statement titled "Human Capital and Compensation Committee Report" and "Audit Committee Report" will not, to the extent permitted by the rules of the SEC, be deemed incorporated, unless specifically provided otherwise in such filing. No information contained on our website, https://www.axiscapital.com, is intended to be included as part of, or incorporated by reference into, this proxy statement. | ||||||
| Proxies Solicited By | The proxies are solicited on behalf of our Board for use at the 2023 Annual General Meeting and any adjournments or postponements thereof and we will bear the cost of the solicitation of proxies. We have engaged Morrow Sodali LLC, 333 Ludlow Street, 5th Floor, South Tower, Stamford, CT 06902, to assist us in the solicitation of proxies and the anticipated cost of such engagement is approximately $6,500. Proxies also may be solicited by our directors, officers and employees and our subsidiaries without receiving additional compensation. The solicitation may be conducted by mail, telephone, telecopy, facsimile, email, Internet and personal solicitation. Upon request, we also will reimburse brokers, banks and others who hold shares in their names, or in the names of nominees, for forwarding proxy materials to the beneficial owners. | ||||||
| Date of Mailing or Availability | We anticipate mailing or making available the Notice of Annual Meeting and the accompanying Proxy Statement on or about March 24, 2023. | ||||||
| Who Can Vote | AXIS' common shareholders of record at the close of business on March 10, 2023 will be entitled to vote at the Annual General Meeting on the basis of one vote for each share held. On March 10, 2023, there were 85,182,723 outstanding common shares entitled to vote at the Annual General Meeting. | ||||||
| Voting | Except as set forth in our bye-laws, each common share entitles the holder of record to one vote. In accordance with our bye-laws, shareholders whose shares constitute 9.5% or more of the voting power of our common shares are entitled to less than one vote for each common share held by them, but only in the event that a U.S. shareholder, as defined in our bye-laws, owning 9.5% or more of our common shares is first determined to exist. We will notify any shareholder whose voting power is reduced prior to the meeting. There are three ways to vote in advance of the meeting: (i) via the Internet, (ii) by telephone, or (iii) by mailing your completed voting information form or proxy card. In addition, you may vote in person at the meeting in Bermuda. | ||||
| ||||||||
| 90 | VOTING AND MEETING INFORMATION | |||||||
| Vote Standards | Quorum. Two or more persons present in person and representing in person or by proxy shares representing more than fifty percent (50%) of the aggregate voting power of the Company constitutes a quorum. Abstentions and “broker non-votes” that are present and entitled to vote at the Annual General Meeting will be counted for purposes of determining a quorum. A “broker non-vote” occurs when a nominee holding shares for a beneficial owner does not have discretionary voting power for a proposal and has not received instructions from the beneficial owner. Under current NYSE rules, the proposal to appoint Deloitte Ltd. as our independent registered public accounting firm is considered a “discretionary” item. Therefore, there will be no “broker non-votes” on the approval of the appointment of Deloitte Ltd. Majority Vote Standard. Assuming that there is a quorum, the affirmative vote of a majority of the votes cast by the holders of shares represented in person or by proxy at the Annual General Meeting is required for: (i) the election of directors; (ii) the non-binding determination of the compensation paid to our named executive officers; (iii) the non-binding determination of the frequency of shareholder votes on executive compensation; (iv) the approval of the Amendment to the Amended and Restated 2017 Long-Term Equity Compensation Plan; and (v) the appointment of Deloitte Ltd. Broker Non-Votes and Abstentions. A broker non-vote occurs when shares held by a broker are not voted with respect to a proposal because (1) the broker has not received voting instructions from the stockholder who beneficially owns the shares and (2) the broker lacks the authority to vote the shares at its discretion. Under current NYSE interpretations that govern broker non-votes, Proposal 1: Election of Directors, Proposal 2: Non-Binding Vote on Executive Compensation, Proposal 3: Non-Binding Vote on the Frequency of Shareholder Votes on Executive Compensation and Proposal 4: Amendment to the Amended and Restated 2017 Long-Term Equity Compensation Plan are considered non-discretionary matters and a broker will lack the authority to vote shares at its discretion on such proposals. Proposal 5: Appointment of Independent Auditors is considered a discretionary matter and a broker will be permitted to exercise its discretion on such proposal. Abstentions and "broker non-votes" (if applicable) will have no effect on the outcome of any of the proposals presented in this proxy statement because such shares are not considered votes cast. Proxies Submitted but Not Voted. We will count common shares held by shareholders who have signed their proxy cards or properly submitted their proxy by phone or over the Internet but have not specified how their shares are to be voted towards the presence of a quorum, and we will vote those shares in accordance with the Board’s recommendations for each of the proposals contained in this proxy statement. | ||||
Notice of Internet Availability of Proxy Materials | As permitted by SEC rules, we have elected to furnish proxy materials, including this Proxy Statement and our Annual Report on Form 10-K, to our beneficial shareholders by providing access to such documents on the Internet instead of mailing printed copies. We plan to mail a Notice of Internet Availability of Proxy Materials on or about March 24, 2023. The Notice explains how you may submit your proxy, including by telephone or over the Internet, and provides instructions on how to request paper copies of our proxy materials. We believe that this process will expedite shareholders’ receipt of our proxy materials while lowering costs associated with printing and mailing and minimizing the environmental impact of printing paper copies. | ||||
| ||||||||
| VOTING AND MEETING INFORMATION | 91 | |||||||
| APPENDIX 1 | |||||
| Years ended | |||||||||||||||||||||||||||||
| 2022 | 2021 | 2020 | |||||||||||||||||||||||||||
| (in thousands) | |||||||||||||||||||||||||||||
| Net income (loss) available (attributable) to common shareholders | $ | 192,833 | $ | 588,359 | $ | (150,674) | |||||||||||||||||||||||
Net investment (gains) losses[a] | 456,789 | (134,279) | (129,133) | ||||||||||||||||||||||||||
Foreign exchange losses (gains)[b] | (157,945) | 315 | 81,069 | ||||||||||||||||||||||||||
Reorganization expenses[c] | 31,426 | — | 7,881 | ||||||||||||||||||||||||||
Interest in (income) loss of equity method investments[d] | (1,995) | (32,084) | 3,612 | ||||||||||||||||||||||||||
| Income tax expense (benefit) | (23,177) | 14,166 | 13,023 | ||||||||||||||||||||||||||
| Operating income (loss) | $ | 497,931 | $ | 436,477 | $ | (174,222) | |||||||||||||||||||||||
| Average common shareholders' equity | $ | 4,475,283 | $ | 4,803,175 | $ | 4,757,351 | |||||||||||||||||||||||
| Adjusted common shareholders' equity | $ | 4,860,656 | — | — | |||||||||||||||||||||||||
Return on average common equity[e] | 4.3% | 12.2% | (3.2%) | ||||||||||||||||||||||||||
Operating return on average common equity[f] | 11.1% | 9.1% | (3.7%) | ||||||||||||||||||||||||||
Operating return on adjusted common equity[g] | 10.2% | —% | —% | ||||||||||||||||||||||||||
| ||||||||
| APPENDIX 1 | A-1 | |||||||
Therefore, foreign exchange losses (gains) are excluded from consolidated operating income (loss)
| ||||||||||
| A-2 | APPENDIX 1 | | ||||||||
Ex-PGAAP Operating Income (Loss)
Ex-PGAAP operating income (loss) represents operating income (loss) exclusive of after-tax amortization of VOBA and intangible assets, and after-tax amortization of acquisition costs, both associated with Novae’s balance sheet at October 2, 2017 (the “closing date” or “acquisition date”). The reconciliation of ex-PGAAP operating income (loss) to net income (loss) available (attributable) to common shareholders, the most comparable GAAP financial measure, is presented in the table above.
We also present ex-PGAAP OROACE, which is derived from the ex-PGAAP operating income (loss) measure and is reconciled to the most comparable GAAP financial measure, ROACE in the table above.
We believe the presentation of ex-PGAAP operating income (loss) and ex-PGAAP OROACE helps investors and other users of our financial information analyze the performance of our business.
Acquisition of Novae
On October 2, 2017, we acquired Novae. At the acquisition date, we identified VOBA which represents the present value of the expected underwriting profit within policies that were in-force at the closing date of the transaction. In addition, the allocation of the acquisition price to the assets acquired and liabilities assumed based on estimated fair values at the acquisition date, resulted in the write-off of the deferred acquisition cost asset on Novae’s balance sheet at the acquisition date as the value of policies in-force on that date are considered within VOBA. Consequently, net income (loss) available (attributable) to common shareholders in 2020, 2019 and 2018 included the recognition of premiums attributable to Novae’s balance sheet at the acquisition date without the recognition of the associated acquisition costs.
| ||||||
| ||||
securities entitled to vote generally in the election of directors (or equivalent management personnel) of the Person resulting from such Business Combination or that, as a result of such Business Combination, owns the Company or all or substantially all of the Company’s assets, either directly or through one or more subsidiaries, in substantially the same proportions as their ownership of the Outstanding Company Voting Securities immediately prior to such Business Combination; (B) no Person (excluding any Person resulting from such Business Combination, or that, as a result of such Business Combination, owns the Company or all or substantially all of the Company’s assets, either directly or through one or more subsidiaries, or any employee benefit plan (or related trust) of the foregoing) beneficially owns, directly or indirectly, 50% or more of the then outstanding Shares or the combined voting power of the then outstanding voting securities entitled to vote generally in the election of directors (or equivalent management personnel) of the Person resulting from such Business Combination or that, as a result of such Business Combination, owns the Company or all or substantially all of the Company’s assets, either directly or through one or more subsidiaries, except to the extent that such ownership existed with respect to the Company prior to the Business Combination; and (C) at least a majority of the members of the board of directors (or equivalent management personnel) of the Person resulting from such Business Combination or that, as a result of such Business Combination, owns the Company or all or substantially all of the Company’s assets, either directly or through one or more subsidiaries,
| ||||||||
| APPENDIX 2 | B-1 | |||||||
| ||||||
| ||||||||
| B-2 | APPENDIX 2 | |||||||
| ||||
| ||||||||
| APPENDIX 2 | B-3 | |||||||
| ||||||
| ||||
| ||||||||
| B-4 | APPENDIX 2 | |||||||
| ||||||
Options granted under the Plan shall be 5,000,0006,125,000 and (iii) the maximum number of Shares subject to Awards granted during a single fiscal year to any Non-Employee Director, taken together with any cash fees paid to such Non-Employee Director during the fiscal year, shall not exceed $600,000 (or $1.5 million for the ChairmanChair of the Board) in total value (calculating the value of any such Awards based on the grant date fair value of such Awards for financial reporting purposes). If, after the effective date of the Plan, any Award granted under the Plan (or any Prior Plan Award granted under the Prior Plan) is forfeited, or otherwise expires, terminates or is canceled or, in the case of “full value” Awards (i.e., Awards other than Options or SARs), is settled in cash or net-withheld to cover taxes (up to, but not exceeding, the applicable minimum tax withholding obligation), in each case, without the delivery of Shares to the Participant of the full number of Shares to which the Award related, then the unissued Shares covered by such forfeited, expired, terminated, canceled, cash-settled or net-withheld Award or Prior Plan Award shall again become available to be delivered pursuant to Awards under the Plan. If Shares issued upon exercise, vesting or settlement of an Option or SAR, or Shares owned by a Participant (which are not subject to any pledge or other security interest), are surrendered or tendered to the Company in payment of the Exercise Price of an Option or any taxes required to be withheld in respect of an Option or SAR, in each case, in accordance with the terms and conditions of the Plan and any applicable Award Agreement, such surrendered or tendered Shares shall not again become available to be delivered pursuant to Awards under the Plan, but rather will count against the aggregate number of Shares with respect to which Awards may be granted under the Plan. Therefore, when an Option or SAR is granted under the Plan and is subsequently exercised or settled, the number of Shares subject to the Option or SAR will be counted against the aggregate number of Shares with respect to which Awards may be granted under the Plan as one Share for every Share subject to such Option or SAR, regardless of the actual number of Shares (if any) used to settle such Option or SAR upon exercise or settlement. Additionally, if the
| ||||||||
| APPENDIX 2 | B-5 | |||||||
| ||||
| ||||||||
| B-6 | APPENDIX 2 | |||||||
| ||||||
| ||||||||
| APPENDIX 2 | B-7 | |||||||
| ||||
(determined (determined as of the Date of Grant). Notwithstanding the foregoing, a SAR granted in tandem with (or in substitution for) an Option previously granted shall have an Exercise Price equal to the Exercise Price of the corresponding Option.
| ||||||
| ||||||||
| B-8 | APPENDIX 2 | |||||||
| ||||
| ||||||||
| APPENDIX 2 | B-9 | |||||||
| ||||||
| ||||||||
| B-10 | APPENDIX 2 | |||||||
| ||||
| ||||||||
| APPENDIX 2 | B-11 | |||||||
| ||||||
Committee (including, without limitation, a Board or Committee resolution, an employment agreement, a notice, a certificate or a letter) evidencing the Award. The Committee need not require an Award Agreement to be signed by the Participant or a duly authorized representative of the Company.
| ||||
| ||||||||
| B-12 | APPENDIX 2 | |||||||
| ||||||
| ||||||||
| APPENDIX 2 | B-13 | |||||||
| ||||
| ||||||
| ||
|
| |
| ||
| ||
 |
| |
|
| |
|
| |
|
 IF VOTING BY MAIL, SIGN, DETACH AND RETURN THE BOTTOM PORTION IN THE ENCLOSED ENVELOPE. IF VOTING BY MAIL, SIGN, DETACH AND RETURN THE BOTTOM PORTION IN THE ENCLOSED ENVELOPE. |
| ||||
|  | |||
|
|
|
|
|
Please sign exactly as name(s) appears hereon. Joint owners should each sign. When signing as attorney, executor, administrator, corporate officer, trustee, guardian, or custodian, please give full title.
| | |||||||||||||
 |  | | ||
| APPENDIX 2 |
2021 Annual Meeting Admission Ticket
2021 Annual General Meeting of Shareholders of AXIS Capital Holdings Limited
May 7, 2021 at 8:30 a.m. Local Time
AXIS House
92 Pitts Bay Road
Pembroke HM 08 Bermuda
Upon arrival, please present this admission ticket and photo identification at the registration desk.
Important Notice Regarding the Availability of Proxy Materials for the
Annual General Meeting of Shareholders to be Held on May 7, 2021:
The Proxy Statement, the 2020 Annual Report to Shareholders and
the Form 10-K of AXIS Capital Holdings Limited for 2020 are available at
https://materials.proxyvote.com/G0692U.
 |
|  |
| IF VOTING BY MAIL, SIGN, DETACH AND RETURN THE BOTTOM PORTION IN THE ENCLOSED ENVELOPE. |
|
|
Notice of 2021 Annual Meeting of Shareholders
Proxy Solicited by Board of Directors for Annual Meeting – May 7, 2021
Albert A. Benchimol, Henry B. Smith and Jamie Steeves, or any of them, each with the power of substitution, are hereby authorized to represent and vote the shares of the undersigned, with all the powers which the undersigned would possess if personally present, at the Annual Meeting of Shareholders of AXIS Capital Holdings Limited to be held on May 7, 2021 or at any postponement or adjournment thereof.
IF THIS PROXY IS PROPERLY EXECUTED AND RETURNED BY MAIL OR PROPERLY SUBMITTED VIA THE INTERNET OR BY PHONE, THE SHARES THAT IT REPRESENTS WILL BE VOTED AS SPECIFIED. IF NO CHOICE IS SPECIFIED, THE SHARES WILL BE VOTED FOR THE ELECTION OF DIRECTORS AND FOR PROPOSALS 2, 3 AND 4.
In their discretion, the Proxies are authorized to vote upon such other business as may properly come before the meeting.
(Items to be voted appear on reverse side)
|
|
Change of Address – Please print new address below. Comments – Please print your comments below.
| |